

Bearish Head & Shoulders Pattern
Both the Nasdaq 100 and S&P 500 are forming Head & Shoulders patterns on their daily chart.
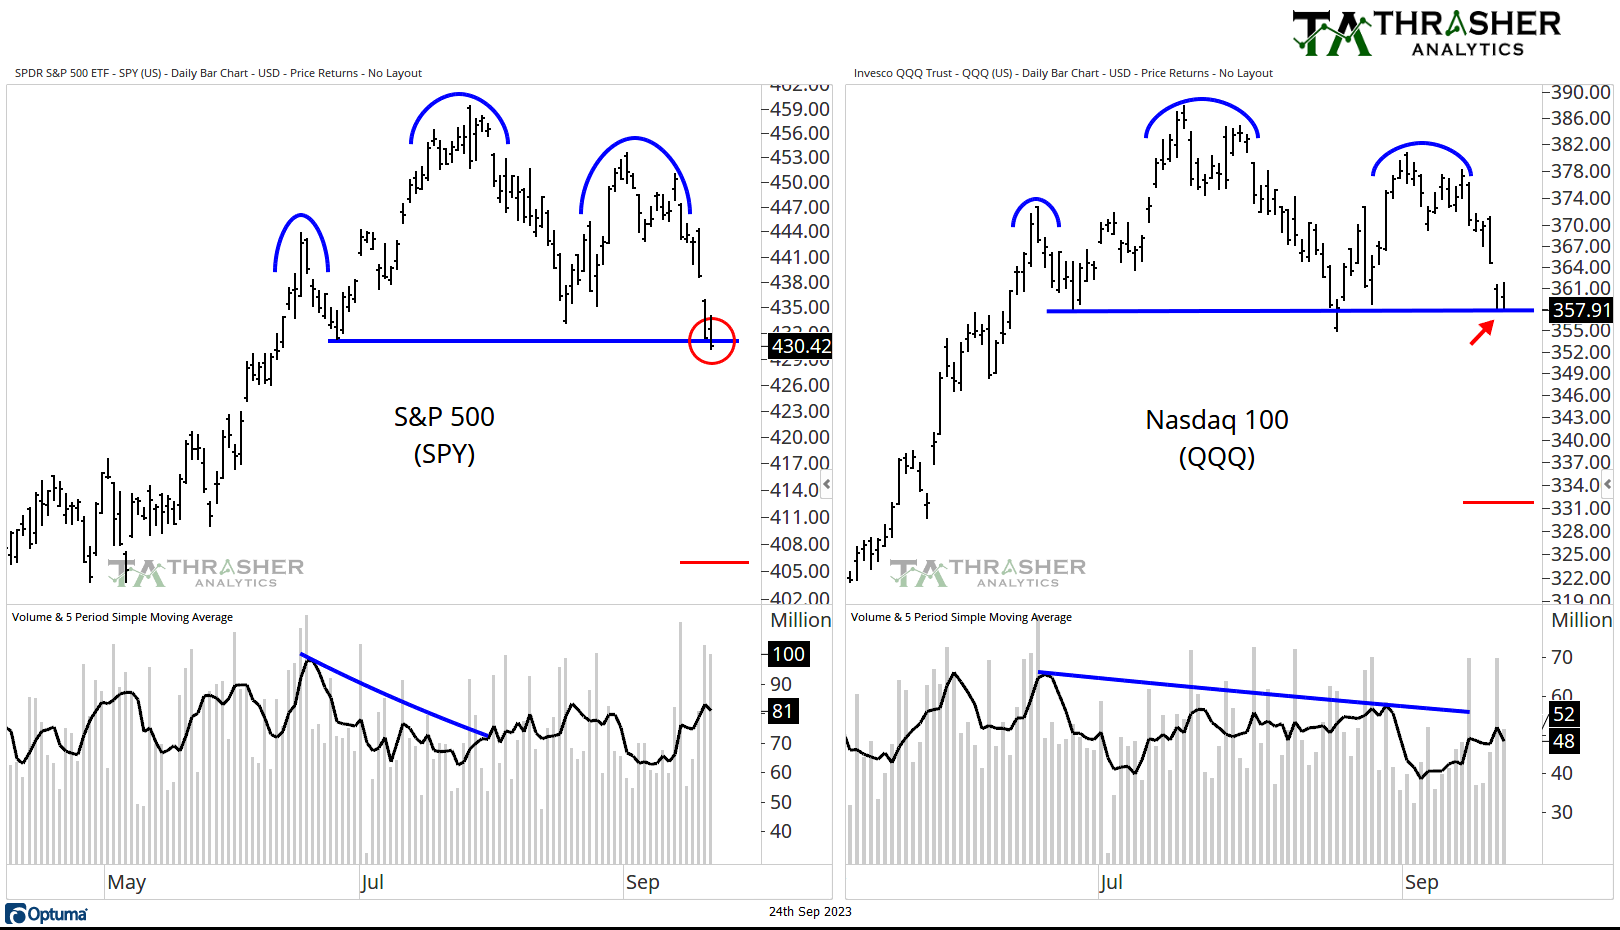
Below is one of the many charts from this week’s Thrasher Analytics letter that was sent to subscribers on Sunday.
Earlier in the month I shared the possible setup of a Head & Shoulders top chart pattern in the S&P 500. I strongly noted that the pattern was irreverent until the neckline broke. The decline on Friday started that breaking process. While technical analysis is mix of science and art, the degree of the ‘neckline’ break leans on the art side of the ledger.
We did indeed close below the prior lows that form the ‘neck’, but the break was just a few points. Also, we haven’t gotten a break yet in the Nasdaq 100 Head & Shoulders top, with Friday’s move closing just above the neck. Both SPY and QQQ have the volume characteristics of a H&S top and the measured moves would suggest a $405 and $331target, respectively. If the ‘necklines’ are indeed broken, then Monday and Tuesday should see strong follow-through with supportive above-average volume to the downside. If not, then the June lows in SPY may still be viewed as support.
Want to subscribe to Thrasher Analytics? Use code “substack” to get 15% off any of the three subscription options. Visit www.ThrasherAnalytics.com to learn more.
Disclaimer: Do not construe anything written in this post or this Substack in its entirety as a recommendation, research, or an offer to buy or sell any securities. Everything in this post is meant for educational and entertainment purposes only. I or my affiliates may hold positions in securities mentioned. 15% discount code “substack” applies to first subscription charge for time period selected upon subscribing, renewals will be at original price.