

Breadth Update 11/13/2024
A Look at Follow Through After New Highs in Individual Stocks
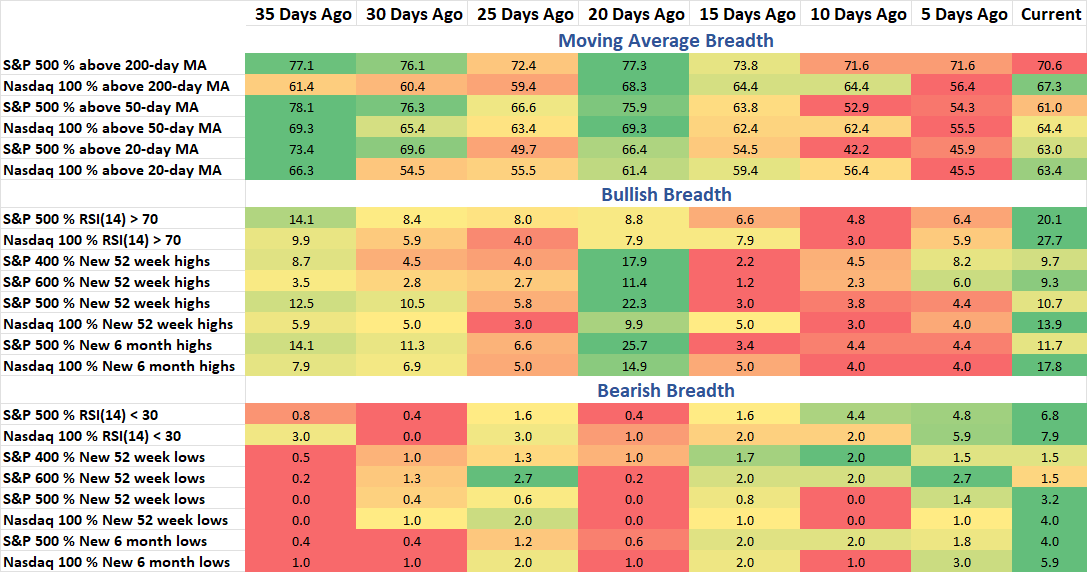
The post-election surge in stock prices helped push breadth stats back to 35-day highs across most metrics. The standout is the % above some of the moving averages, which I’ll address below. But new high lists were fairly strong across asset size.
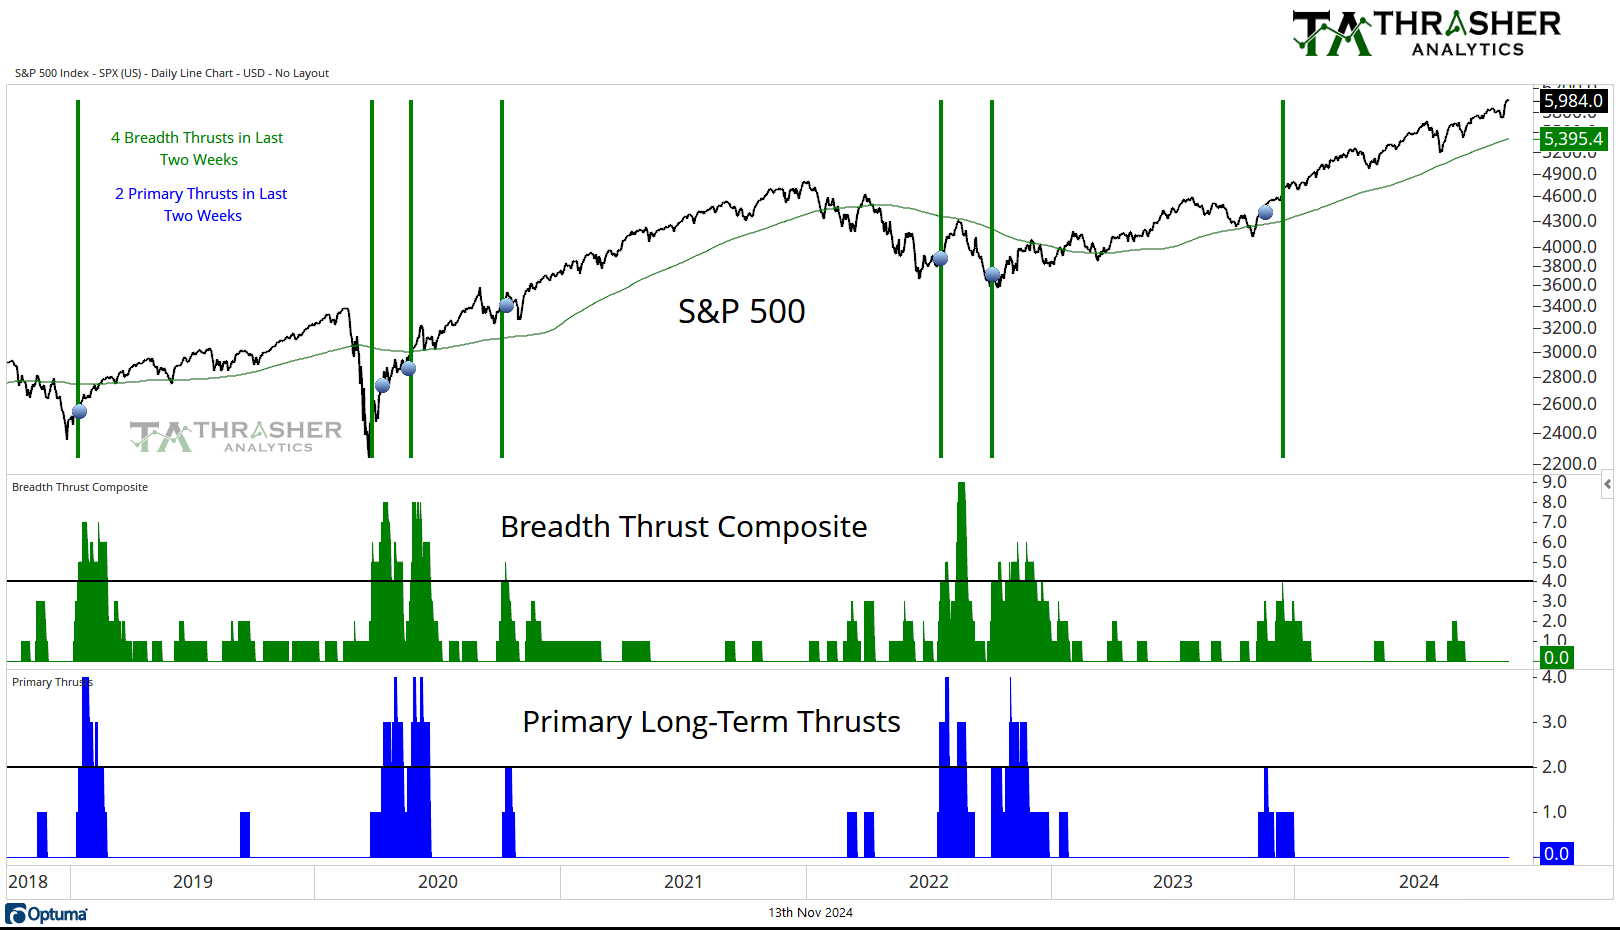
Breadth Thrust Composite
A collection of multiple breadth thrust indicators based on different indices that incorporate price and volume to mark when extremely strong buying activity is taking place by the movement of individual stocks. When multiple of these thrusts occur in a short period of time, the reaction in the S&P 500 has historically been positive going forward.
No change from last week, the count remains at 0.
Keep reading with a 7-day free trial
Subscribe to Thrasher Analytics to keep reading this post and get 7 days of free access to the full post archives.