

Breadth Update 11/19/2024
An Uptick in 52-week Lows But No Major Signs of Distribution As of Yet
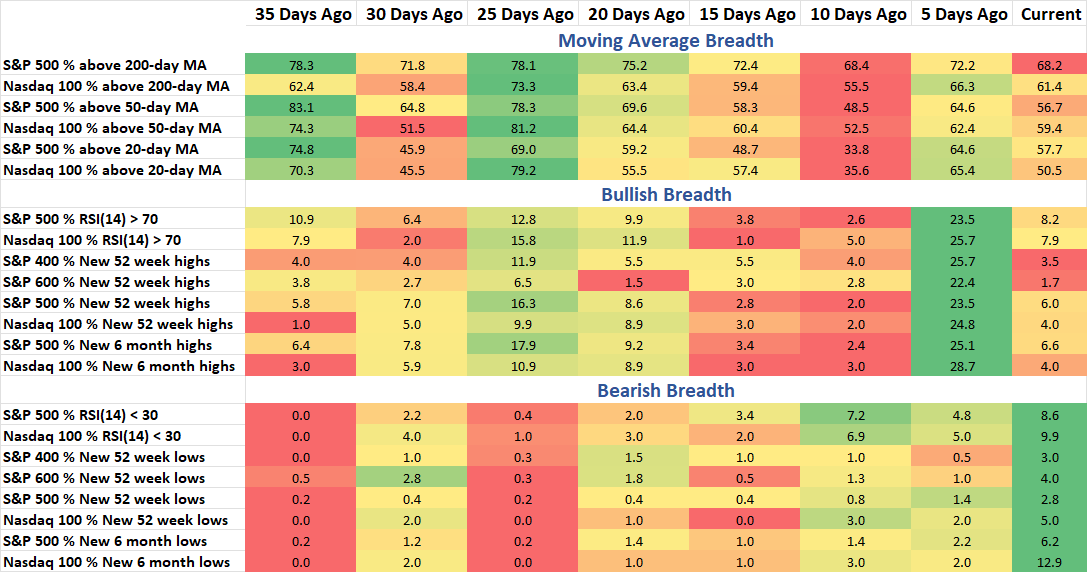
Last week I shared how we had over 20% follow through on new highs and that had led previously to short-term pullbacks. That’s what we began to see last week as the S&P 500 pulled back. But the majority of stocks are still above their intermediate moving average, at 59.4% above the 50-day MA. Bearish breadth data has ticked higher, to the highest numbers int he last month but still in the single digits. Later in this note I look specifically at 52-week lows as well as the lack of any major advance or decline days in the last week.
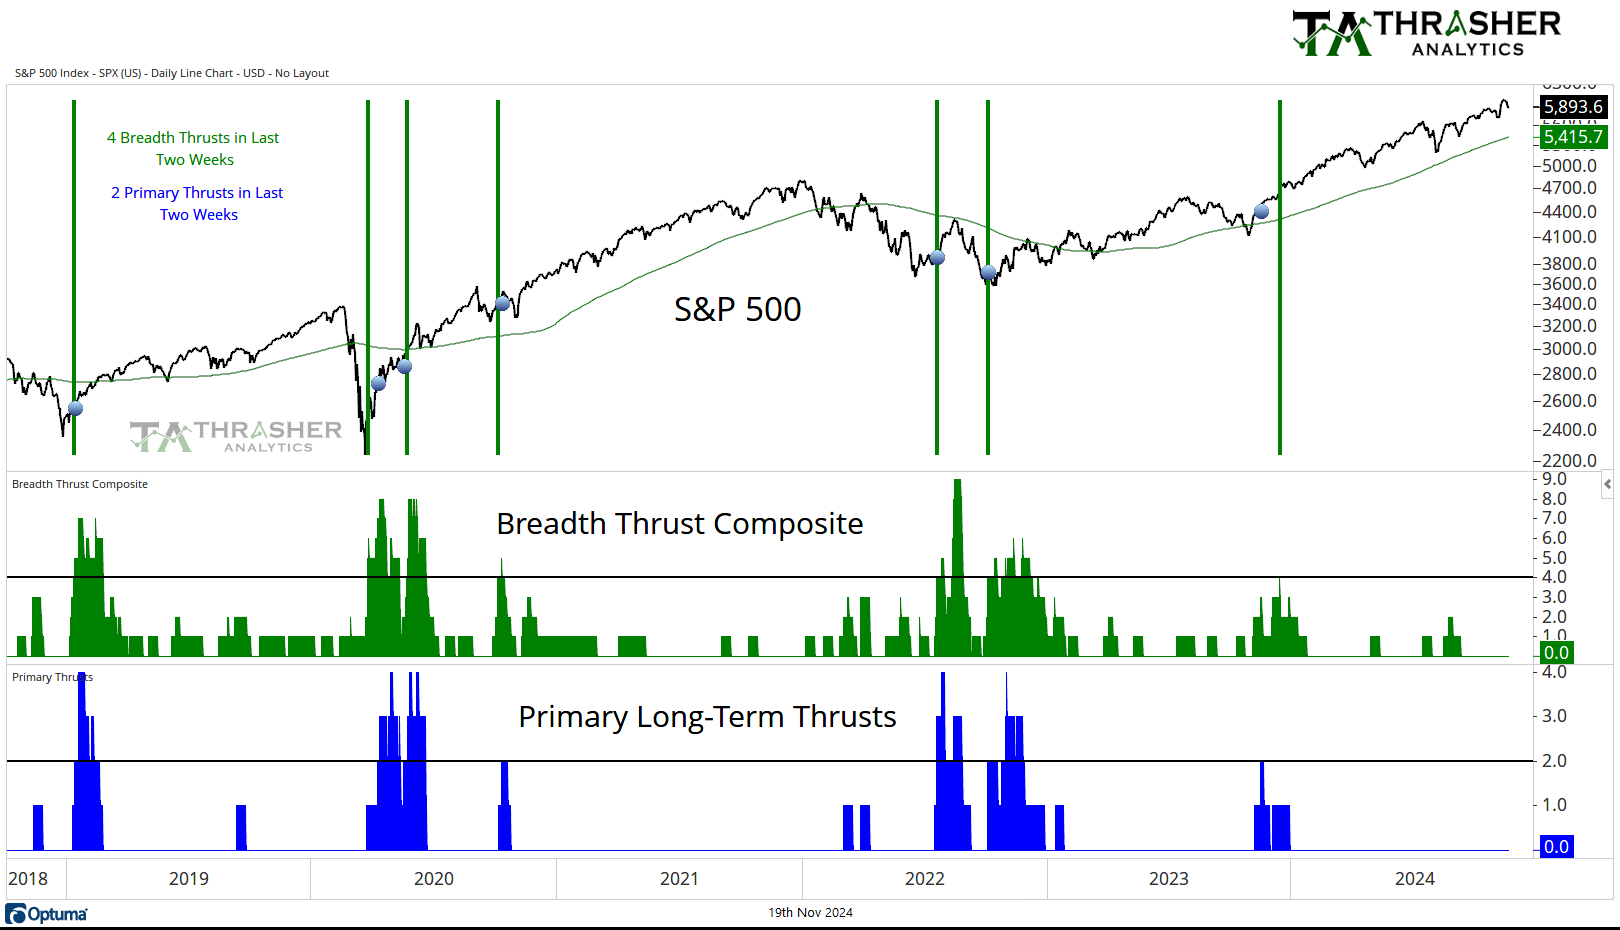
Breadth Thrust Composite
A collection of multiple breadth thrust indicators based on different indices that incorporate price and volume to mark when extremely strong buying activity is taking place by the movement of individual stocks. When multiple of these thrusts occur in a short period of time, the reaction in the S&P 500 has historically been positive going forward.
No change from last week, the count remains at 0.
Keep reading with a 7-day free trial
Subscribe to Thrasher Analytics to keep reading this post and get 7 days of free access to the full post archives.