

Breadth Update 11/26/2024
Back-to-Back Strong Breadth Days, is it Bullish or Bearish?
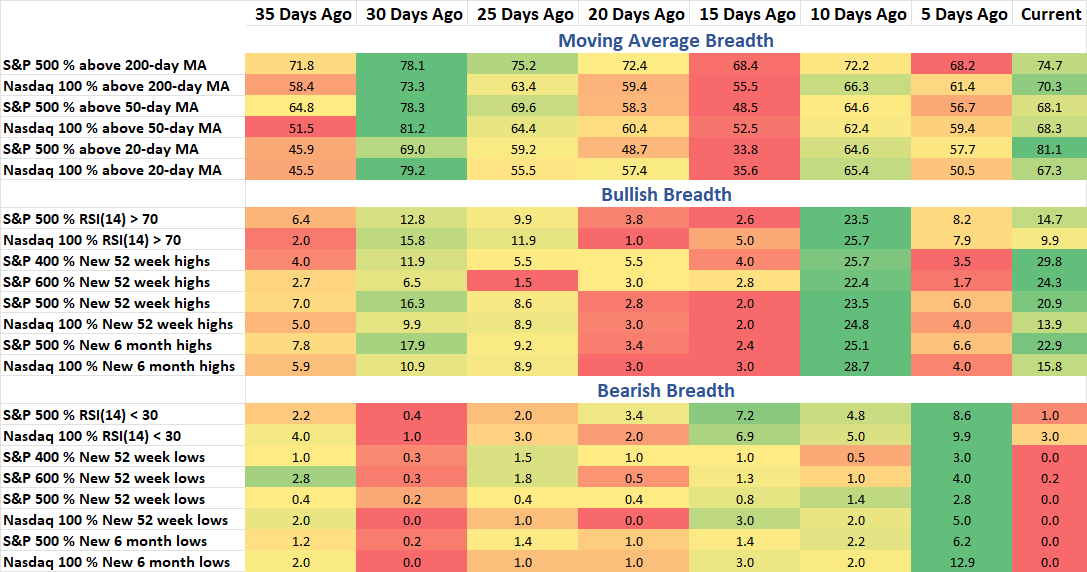
Breadth data saw some bullish improvements over the last week. More stocks are getting back above their key moving averages and in the last three days have been more than 75% advancing. On Monday, 26% of large caps, 39% mid cap, and 34% small cap stocks made a new 3-month high. This week’s breadth note looks at the average performance of large cap and mega cap stocks, a closer look at the moving average breadth data, and the historical implications of when we see this many back-to-back strong advancing days and when it’s been bullish and when it’s been bearish for the S&P 500.
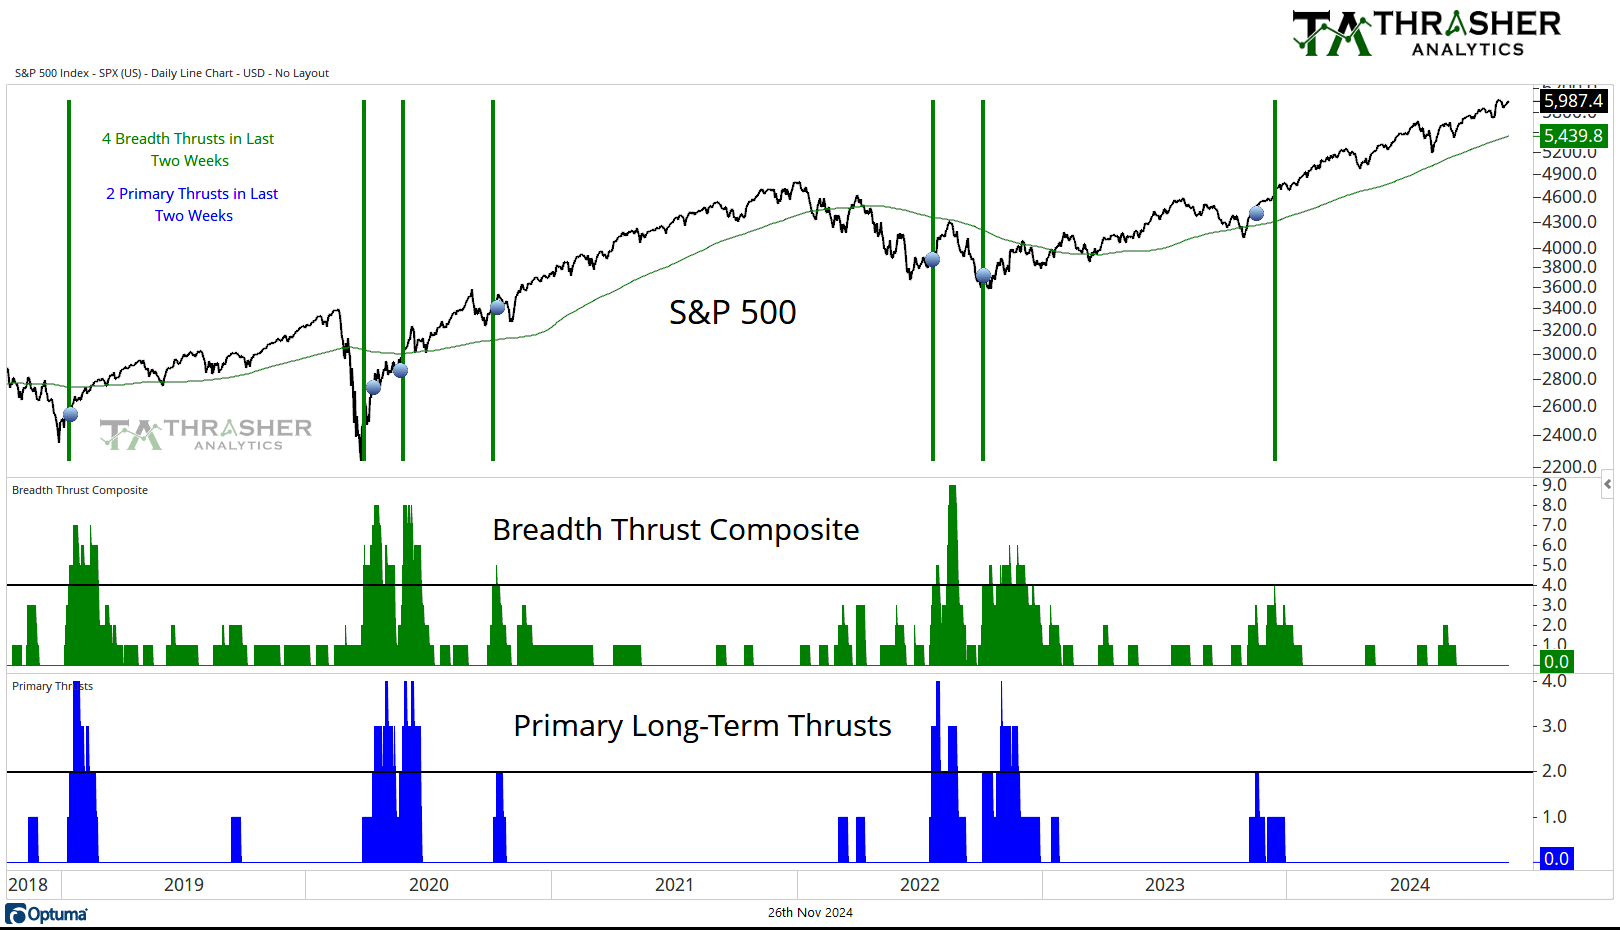
Breadth Thrust Composite
A collection of multiple breadth thrust indicators based on different indices that incorporate price and volume to mark when extremely strong buying activity is taking place by the movement of individual stocks. When multiple of these thrusts occur in a short period of time, the reaction in the S&P 500 has historically been positive going forward.
No change from last week, the count remains at 0.
Keep reading with a 7-day free trial
Subscribe to Thrasher Analytics to keep reading this post and get 7 days of free access to the full post archives.