

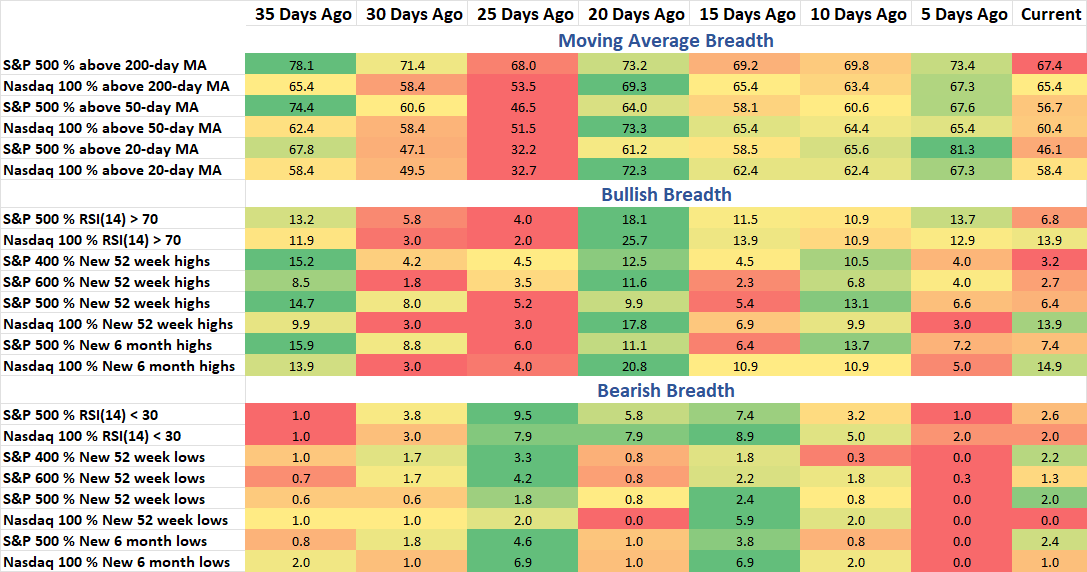
Breadth data is starting to be concerning. With the new high in SPX on Friday, only 46% of stocks are still above their 20-day MA and barely half are above their 50-day average. In today’s note I share a look at the drawdown data for individual stocks as well as a look at the performance data of stocks that are up or down 5+ or 10+% and what this data has meant for the market over the last year.
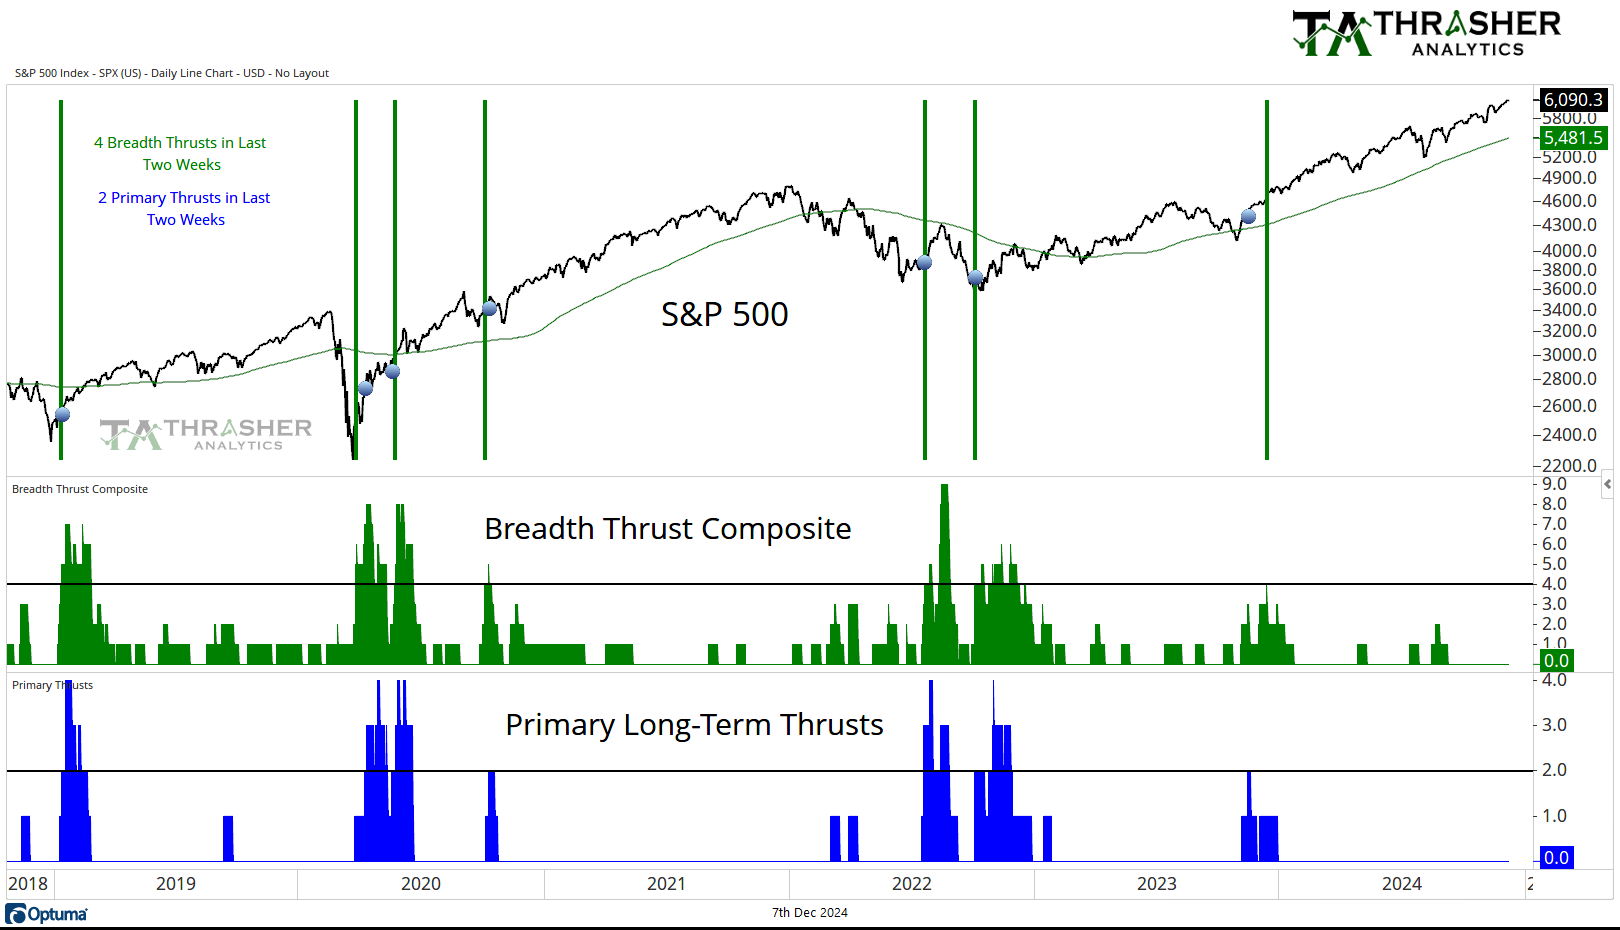
Breadth Thrust Composite
A collection of multiple breadth thrust indicators based on different indices that incorporate price and volume to mark when extremely strong buying activity is taking place by the movement of individual stocks. When multiple of these thrusts occur in a short period of time, the reaction in the S&P 500 has historically been positive going forward.
No change from last week, the count remains at 0.
Keep reading with a 7-day free trial
Subscribe to Thrasher Analytics to keep reading this post and get 7 days of free access to the full post archives.