

Breadth Update 12/16/2024
Growing Number of Stocks Are Falling Below Their Intermediate Average
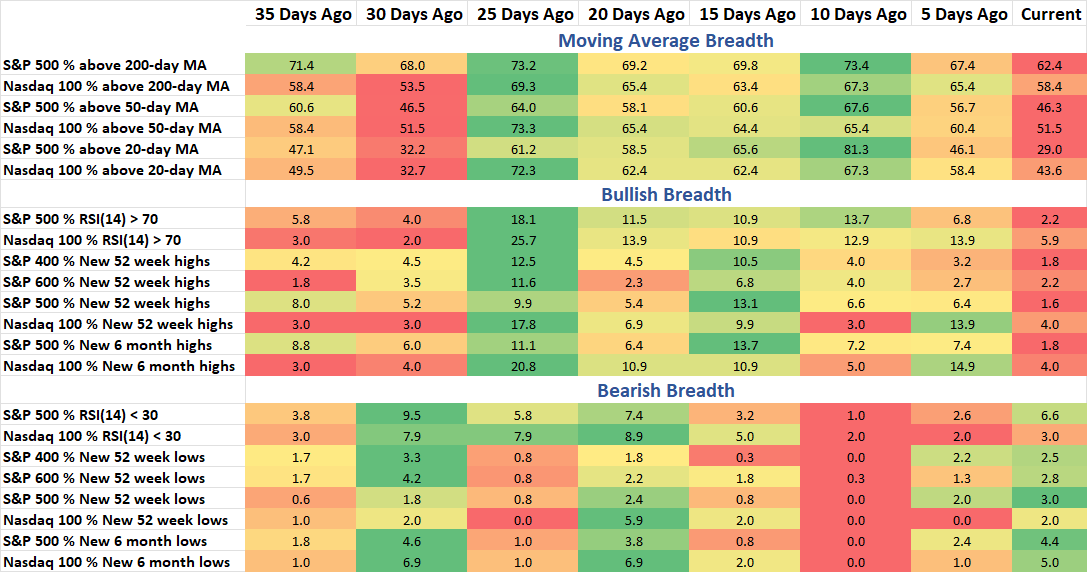
Breadth data has continued to soften with a streak of negative days below the surface, that was masked by a minor decline last week in the S&P 500. We now have more stocks that are “oversold” than “overbought (net 4.4%) while we are barely off the highs in the Index. More stocks are below the 50-day MA as well. However, as I discuss later in the note, we don’t have signs of bearish breadth expansion to signify a reason to turn bearish. The lack of bullish breadth alone isn’t enough to turn negative on the market, it needs to be followed up by an expansion of bearish data to provide confirmation - and we don’t have that just yet.
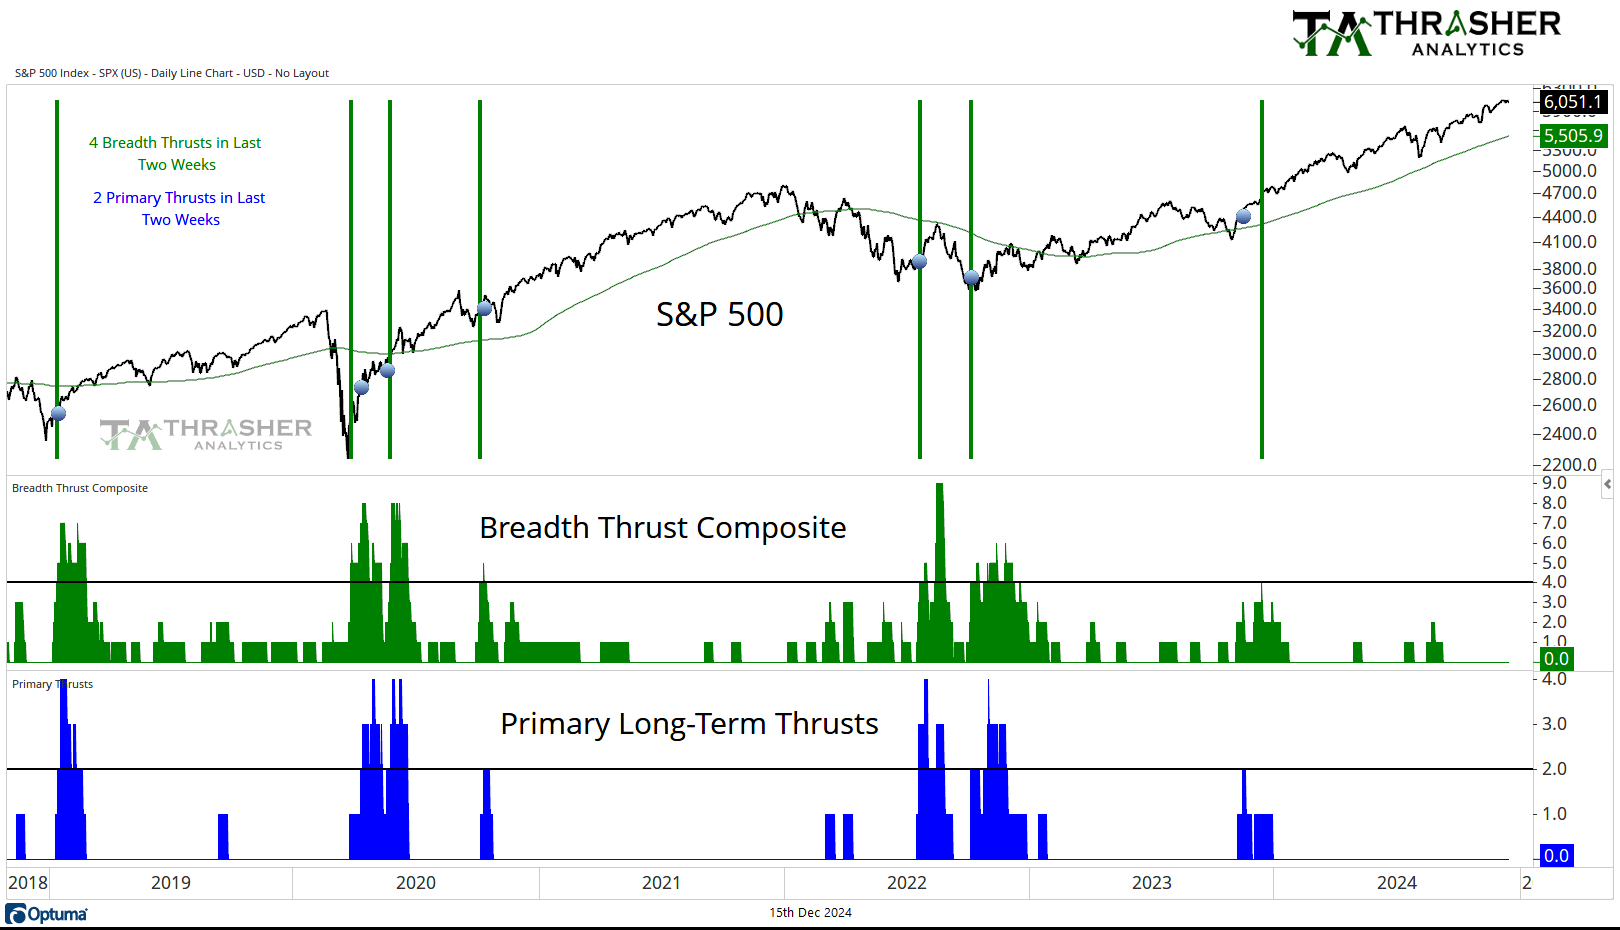
Breadth Thrust Composite
A collection of multiple breadth thrust indicators based on different indices that incorporate price and volume to mark when extremely strong buying activity is taking place by the movement of individual stocks. When multiple of these thrusts occur in a short period of time, the reaction in the S&P 500 has historically been positive going forward.
No change from last week, the count remains at 0.
Keep reading with a 7-day free trial
Subscribe to Thrasher Analytics to keep reading this post and get 7 days of free access to the full post archives.