

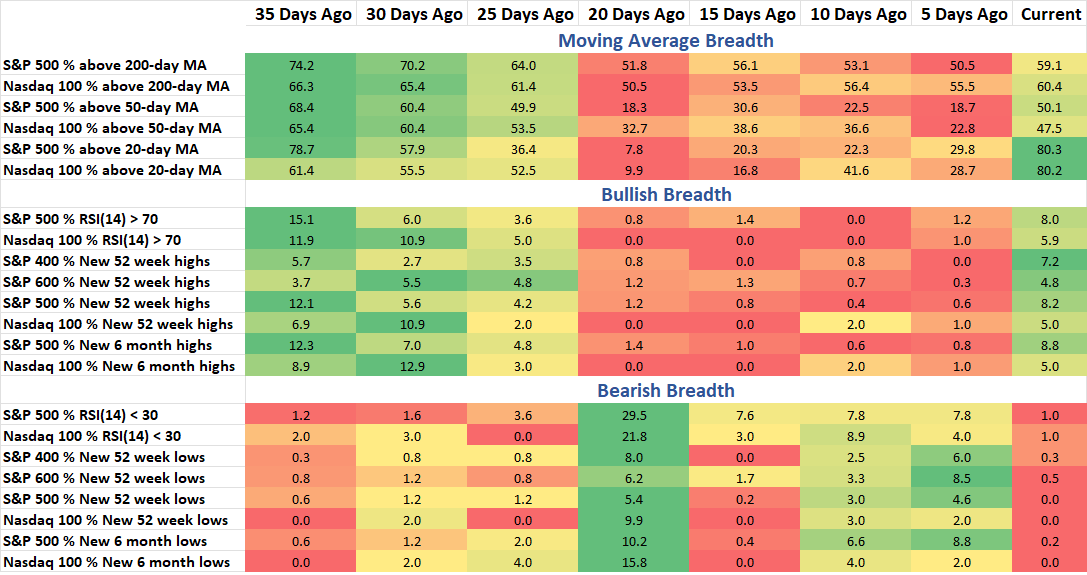
Breadth has been improving with some green showing up in all the bullish breadth categories for the first time in 25 days. Moving Average breadth has risen almost 60% of large cap stocks back above their long-term average. Today’s note looks at the net new high list and the lack of major levels being hit in the pullback as well as a breakdown of new highs by asset size and where strength is showing up.
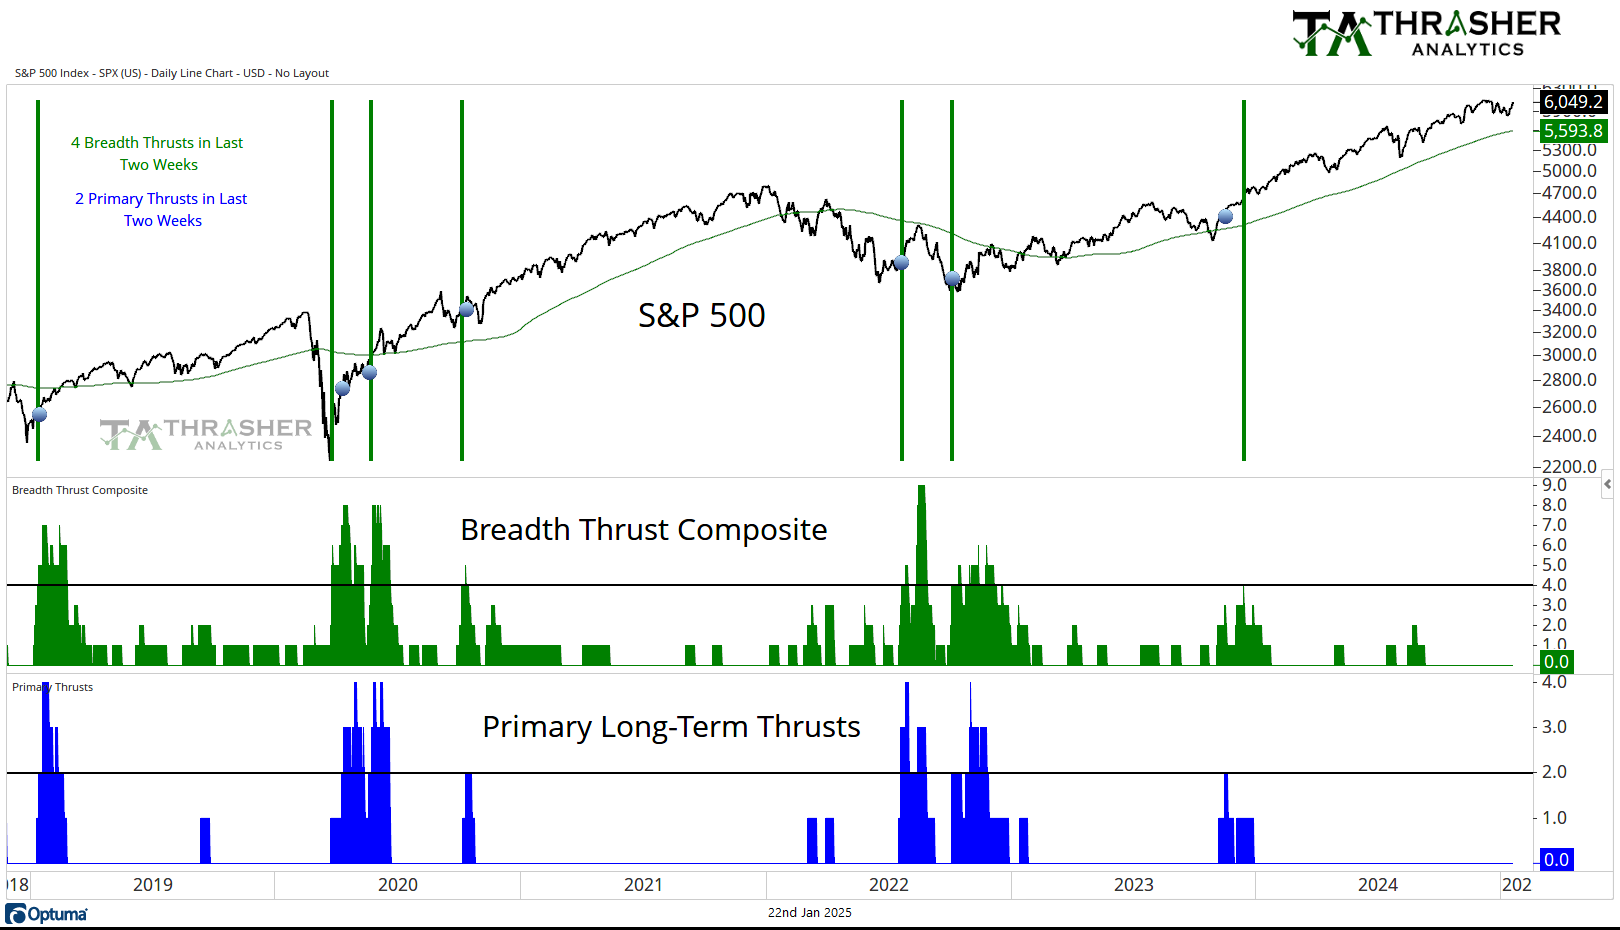
Breadth Thrust Composite
A collection of multiple breadth thrust indicators based on different indices that incorporate price and volume to mark when extremely strong buying activity is taking place by the movement of individual stocks. When multiple of these thrusts occur in a short period of time, the reaction in the S&P 500 has historically been positive going forward.
No change from last week, the count remains at 0.
Keep reading with a 7-day free trial
Subscribe to Thrasher Analytics to keep reading this post and get 7 days of free access to the full post archives.