

Breadth Update 12/24/2024
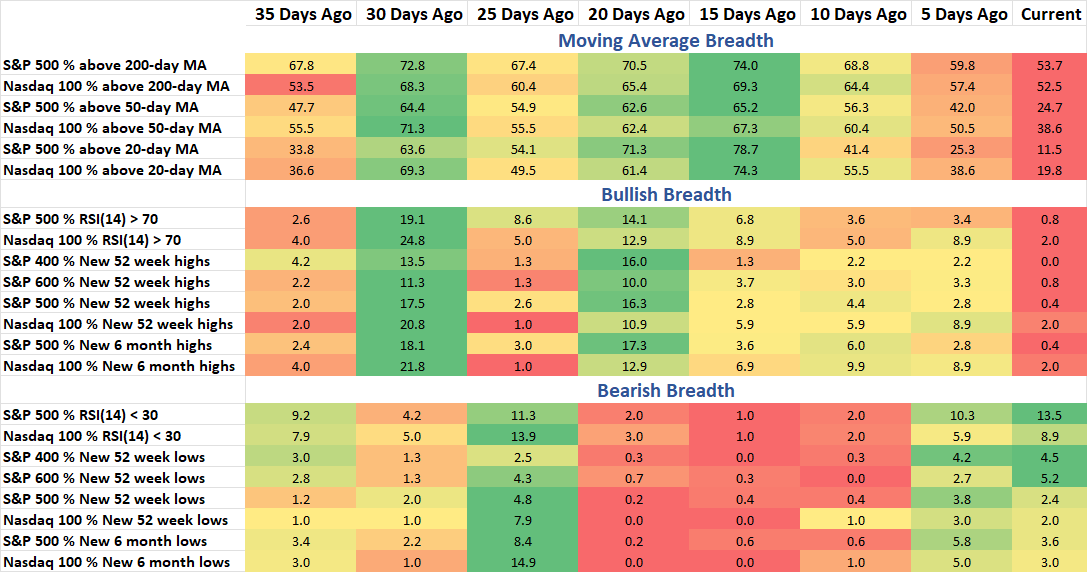
More Stocks Are Becoming "Oversold" And Hitting Multi-Month Lows
The Spotlight Chart in Sunday’s note showed the potential for a short-term bounce in stocks based on specific breadth data. But looking longer-term, there’s a growing number of stocks that are hitting multi-month lows that is concerning to me. We don’t see this type of price action very often, and in the last chart below you’ll see some seminaries between today, 2022, 2015, and 2007. This doesn’t mean we are repeating those periods of time, but the market is on shaky ground at this time. This can be corrected through bullish price action but must be watched closely. Also in this week’s Breadth & Momentum note is a look at momentum breadth and the number of stocks “oversold” and what it means for short-term price action in the Index.
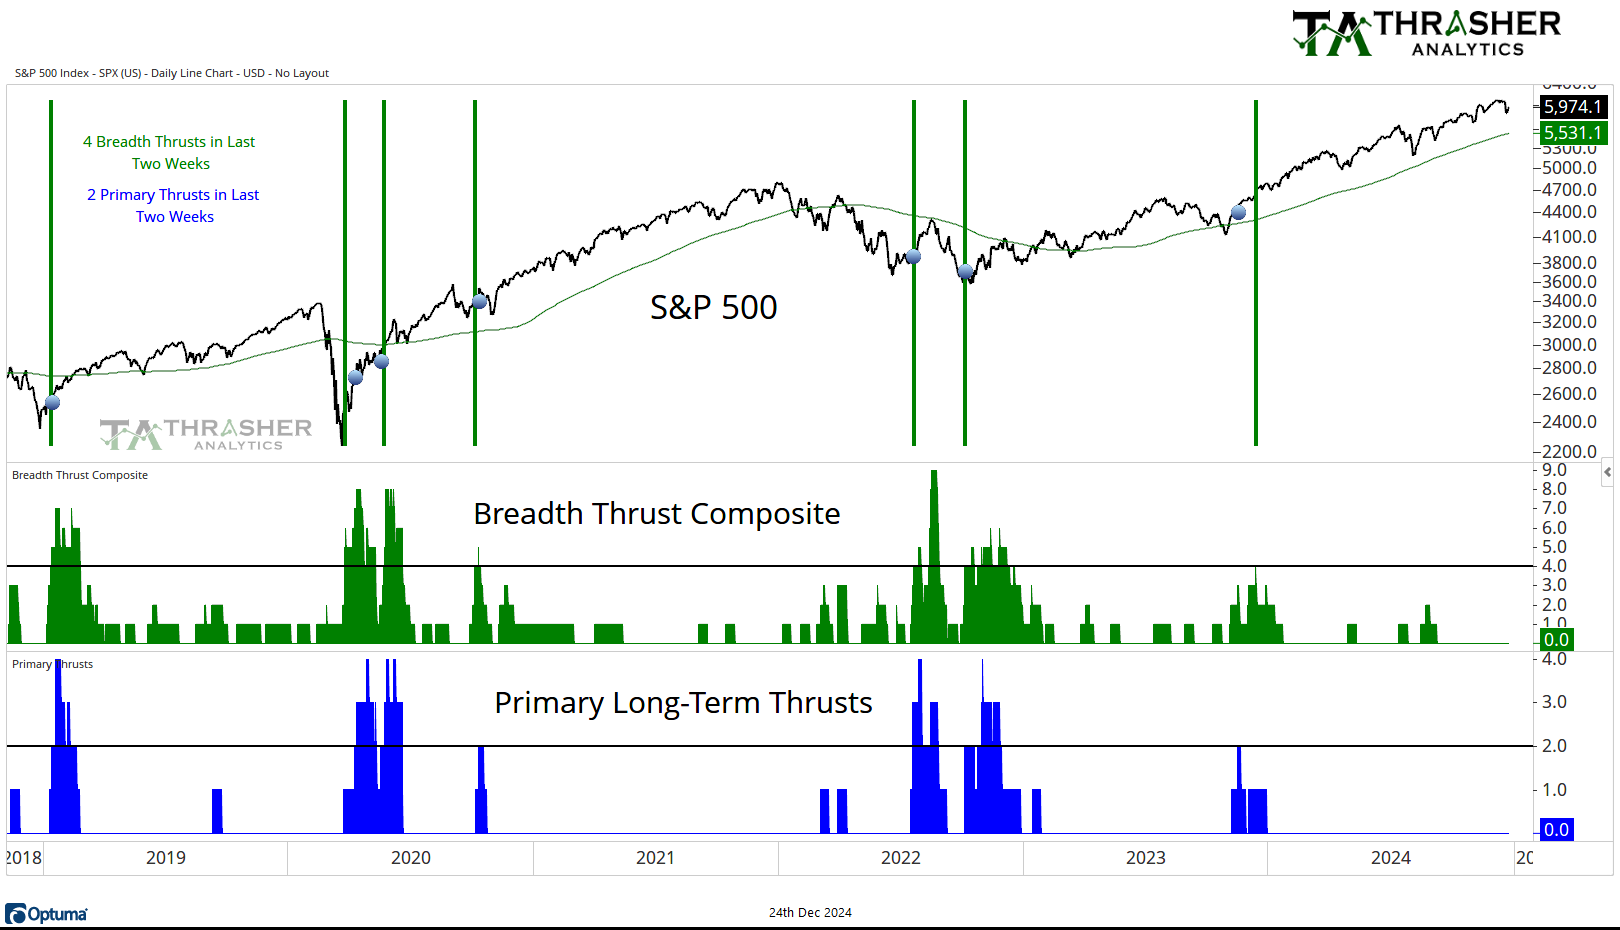
Breadth Thrust Composite
A collection of multiple breadth thrust indicators based on different indices that incorporate price and volume to mark when extremely strong buying activity is taking place by the movement of individual stocks. When multiple of these thrusts occur in a short period of time, the reaction in the S&P 500 has historically been positive going forward.
No change from last week, the count remains at 0.
Keep reading with a 7-day free trial
Subscribe to Thrasher Analytics to keep reading this post and get 7 days of free access to the full post archives.