

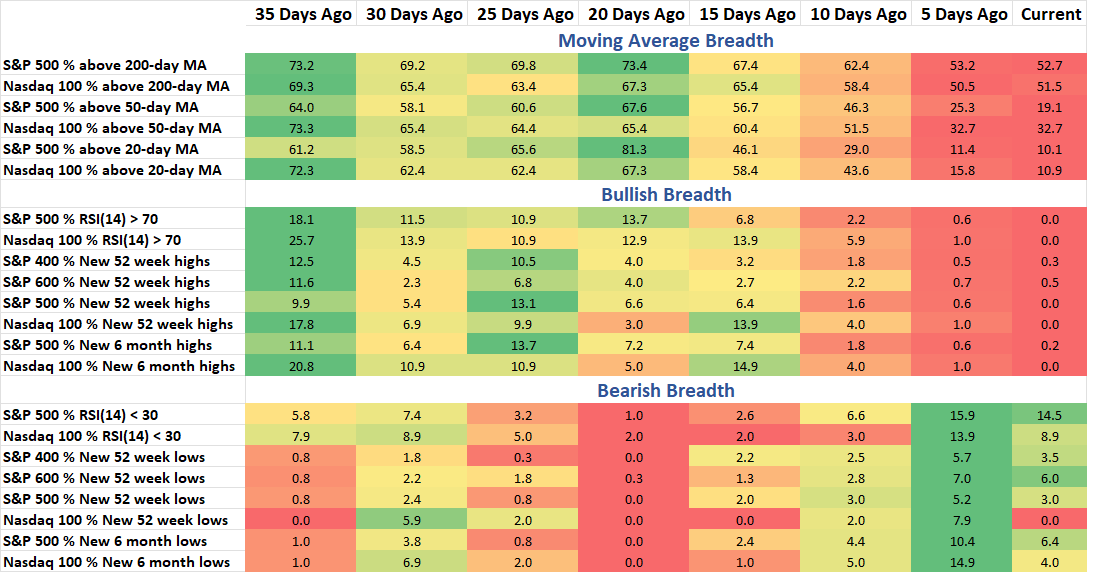
We are ending the year with sellers showing more strength with back-to-back 90% down days in large caps as 93.8% of S&P 500 stocks fell on Monday. 31% of stocks are now down 10+% over the last month (44% are down 5+% during the same time period). I’m still watching for signs of bearish breadth expansion. The last chart in today’s Breadth note is one of the most important breadth charts I’m watching right now and could provide a key insight into if what we are experiencing with this minor pullback in the market could turn into something more significant or just be shallow counter-trend move.
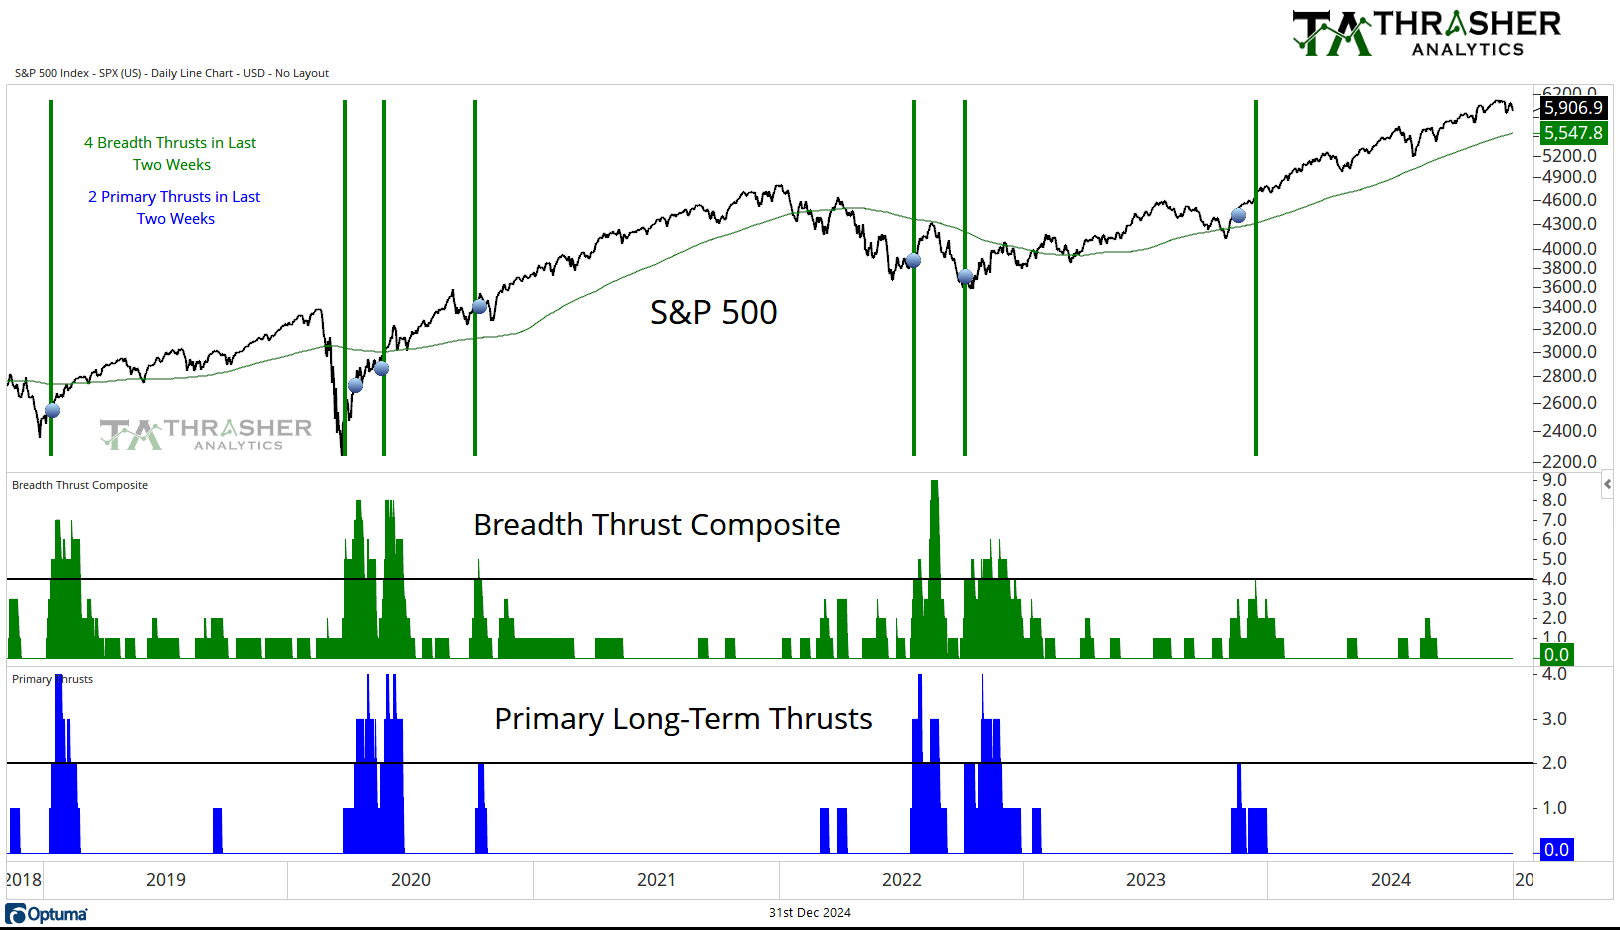
Breadth Thrust Composite
A collection of multiple breadth thrust indicators based on different indices that incorporate price and volume to mark when extremely strong buying activity is taking place by the movement of individual stocks. When multiple of these thrusts occur in a short period of time, the reaction in the S&P 500 has historically been positive going forward.
No change from last week, the count remains at 0.
Keep reading with a 7-day free trial
Subscribe to Thrasher Analytics to keep reading this post and get 7 days of free access to the full post archives.