

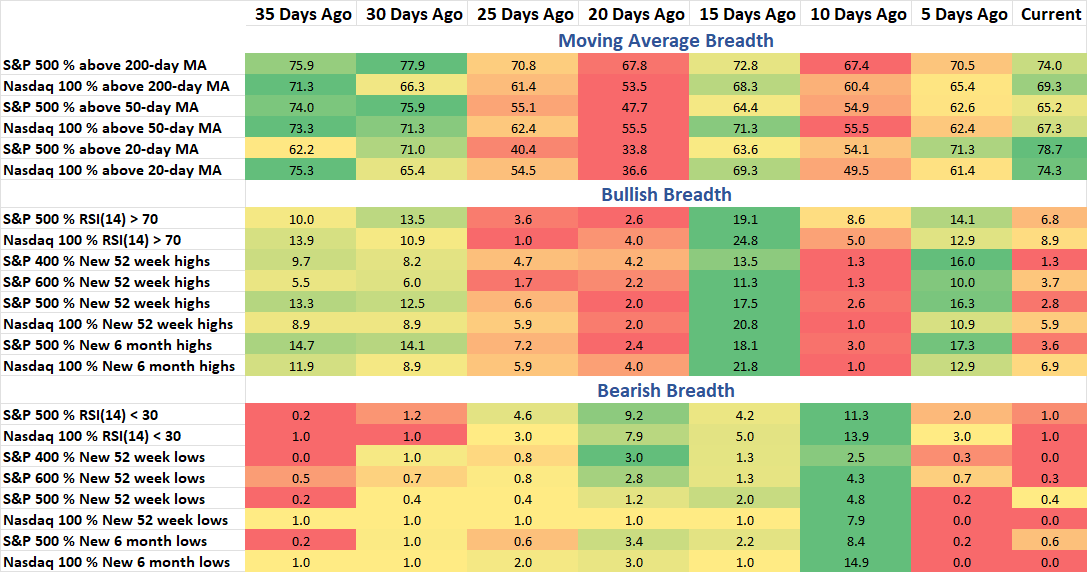
A short note this week on breadth as last week didn’t see a whole lot change across the equity market. We’ve seen the percent of stocks in the S&P 500 above the intermediate moving average go from 74% to 65%. While 65% is still a healthy number, it is off the high. The Nasdaq 100 is also showing a contraction in new highs across timeframes. This could all be easily corrected this week as traders return and trading volume picks back up. We’ll see if that takes place.
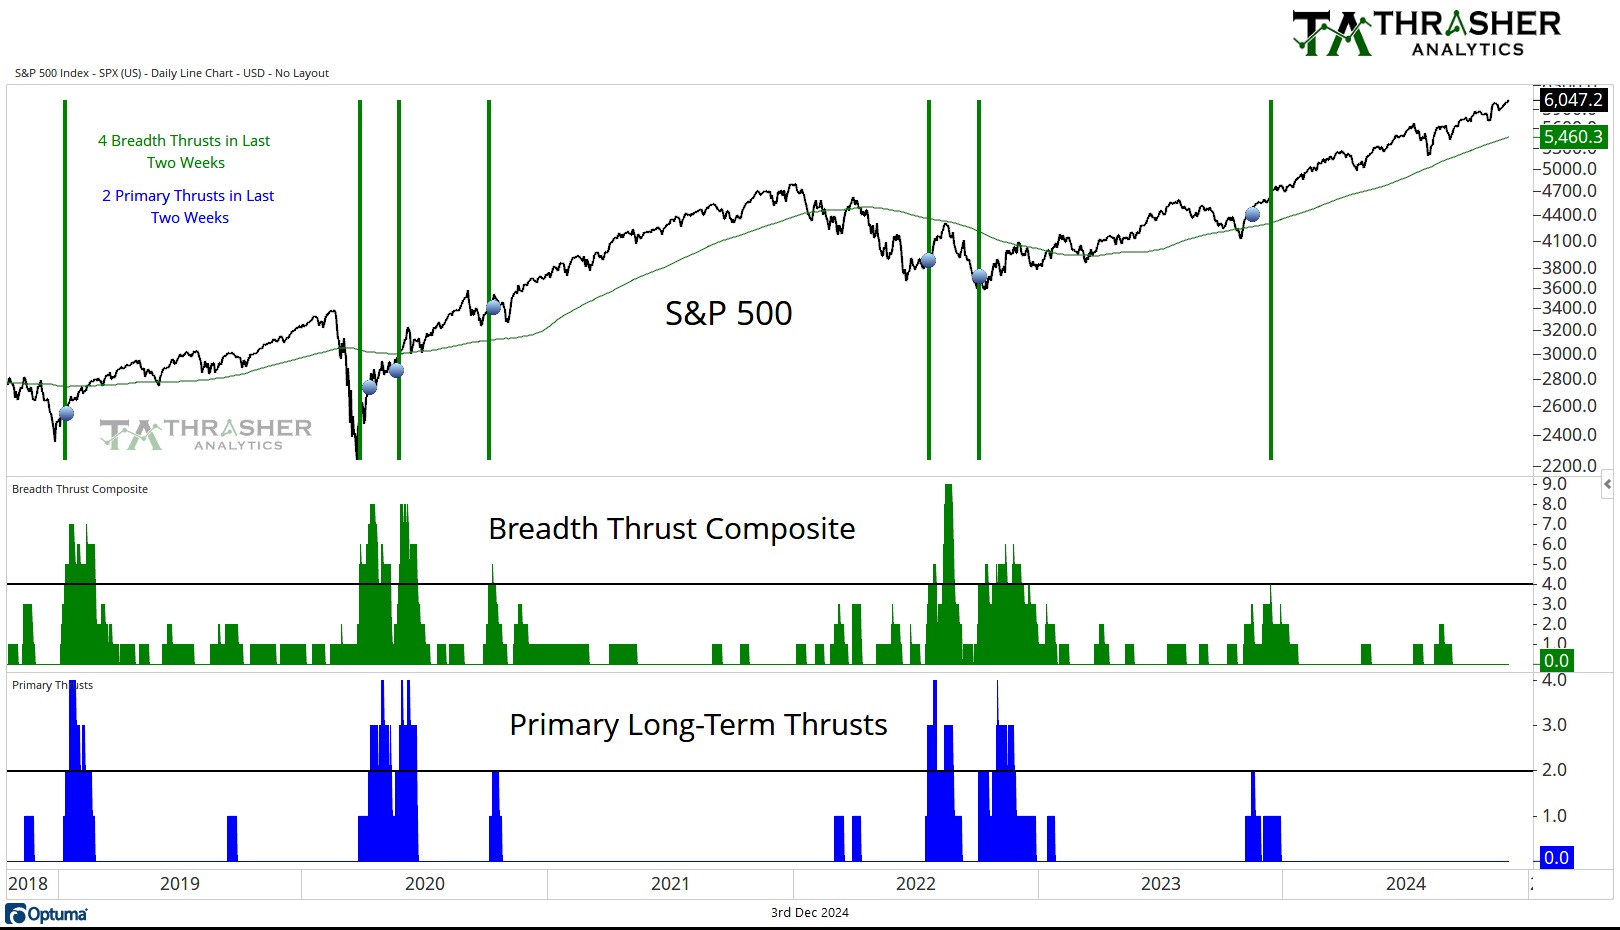
Breadth Thrust Composite
A collection of multiple breadth thrust indicators based on different indices that incorporate price and volume to mark when extremely strong buying activity is taking place by the movement of individual stocks. When multiple of these thrusts occur in a short period of time, the reaction in the S&P 500 has historically been positive going forward.
No change from last week, the count remains at 0.
Keep reading with a 7-day free trial
Subscribe to Thrasher Analytics to keep reading this post and get 7 days of free access to the full post archives.