

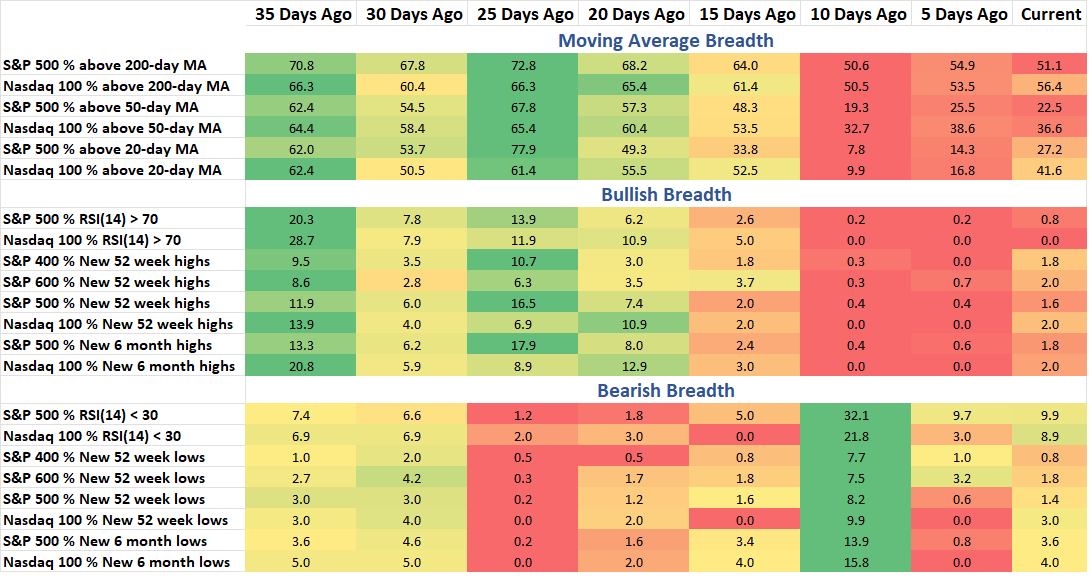
The breadth picture for large cap equities continues to not look great. Nearly half of the stocks in the S&P 500 are below their long-term average while we sit just a couple percent off the all-time high. A rising number of stocks are hitting multi-week and multi-month new lows with over 40% of stocks down over 5% in the last three months. Price is beginning to respond to the poor internals, but as I noted in Sunday’s note - key support levels remain intact and should be monitored.
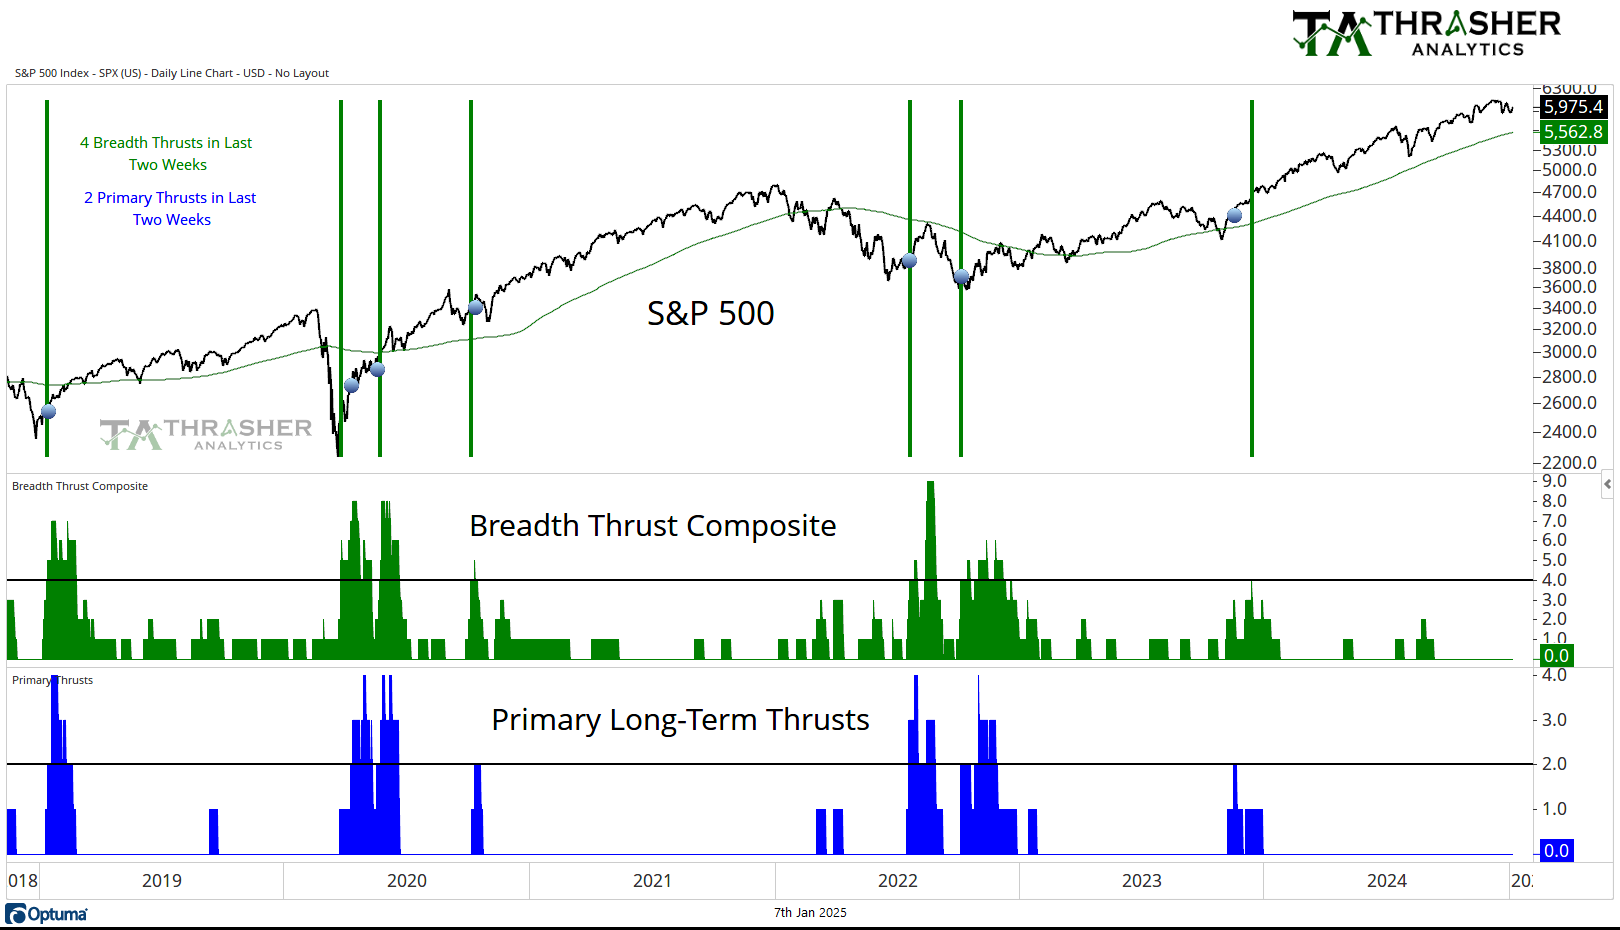
Breadth Thrust Composite
A collection of multiple breadth thrust indicators based on different indices that incorporate price and volume to mark when extremely strong buying activity is taking place by the movement of individual stocks. When multiple of these thrusts occur in a short period of time, the reaction in the S&P 500 has historically been positive going forward.
No change from last week, the count remains at 0.
Keep reading with a 7-day free trial
Subscribe to Thrasher Analytics to keep reading this post and get 7 days of free access to the full post archives.