

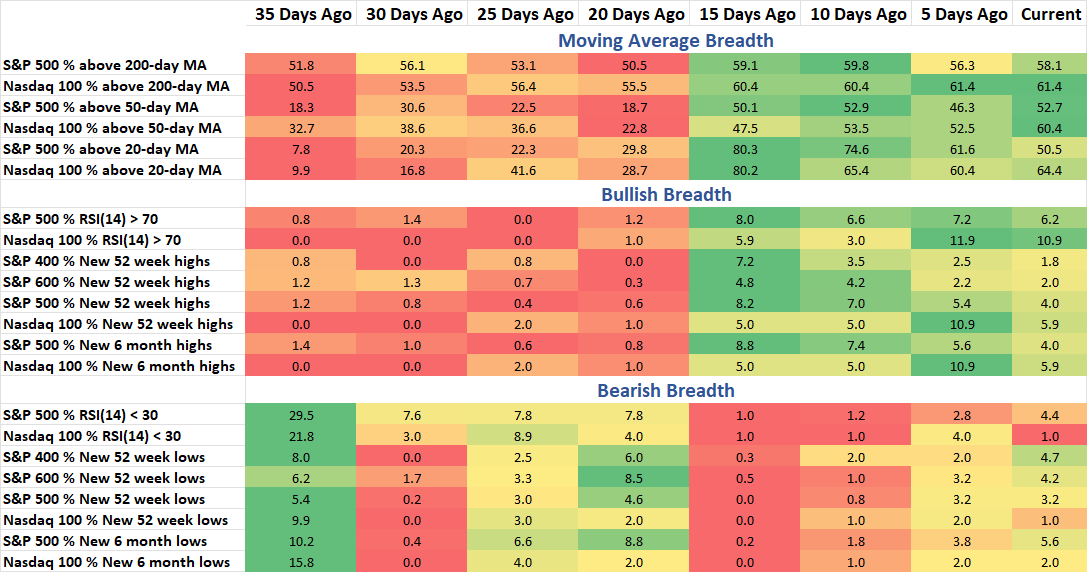
Still on hold for any big changes in the breadth data. The S&P 500 still remains below the prior high and above the latest lows. Stocks seem to be following that same kind of pattern with both bullish and bearish breadth stats in a shade of yellow-ish green, meaning they have improved recently but aren’t at the highest levels over the last 35 days. Below, I take a look at how individual stocks are performing based on how many are up or down 5% or 10% and what that could mean for the broader market.
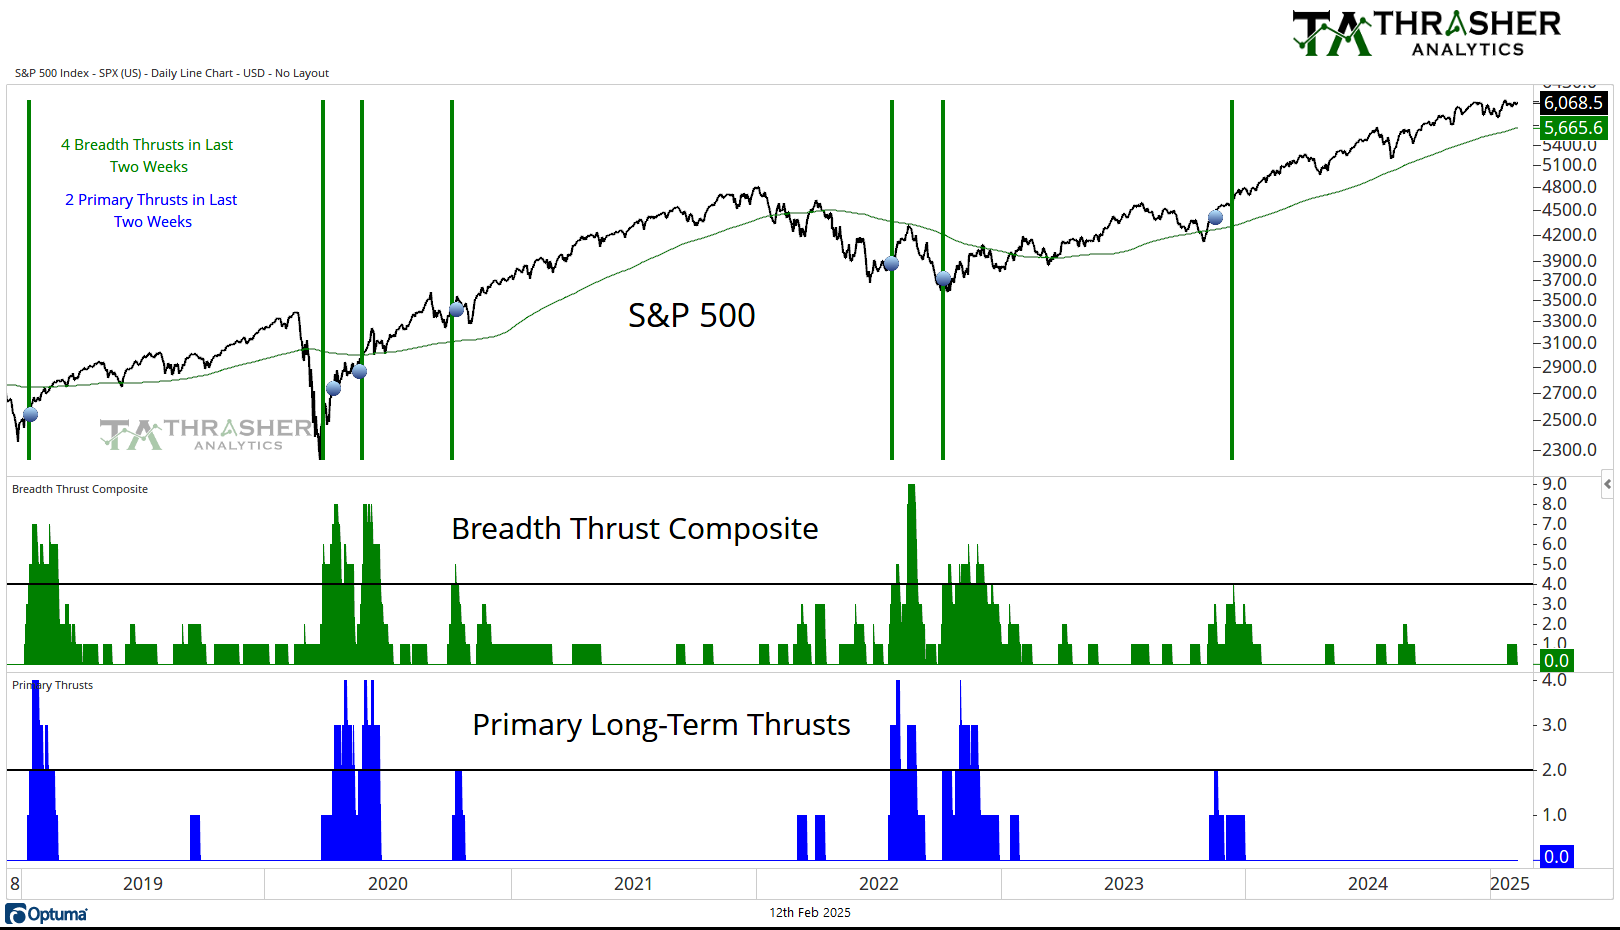
Breadth Thrust Composite
A collection of multiple breadth thrust indicators based on different indices that incorporate price and volume to mark when extremely strong buying activity is taking place by the movement of individual stocks. When multiple of these thrusts occur in a short period of time, the reaction in the S&P 500 has historically been positive going forward.
Breadth Thrust Composite fell back to 0.
Keep reading with a 7-day free trial
Subscribe to Thrasher Analytics to keep reading this post and get 7 days of free access to the full post archives.