

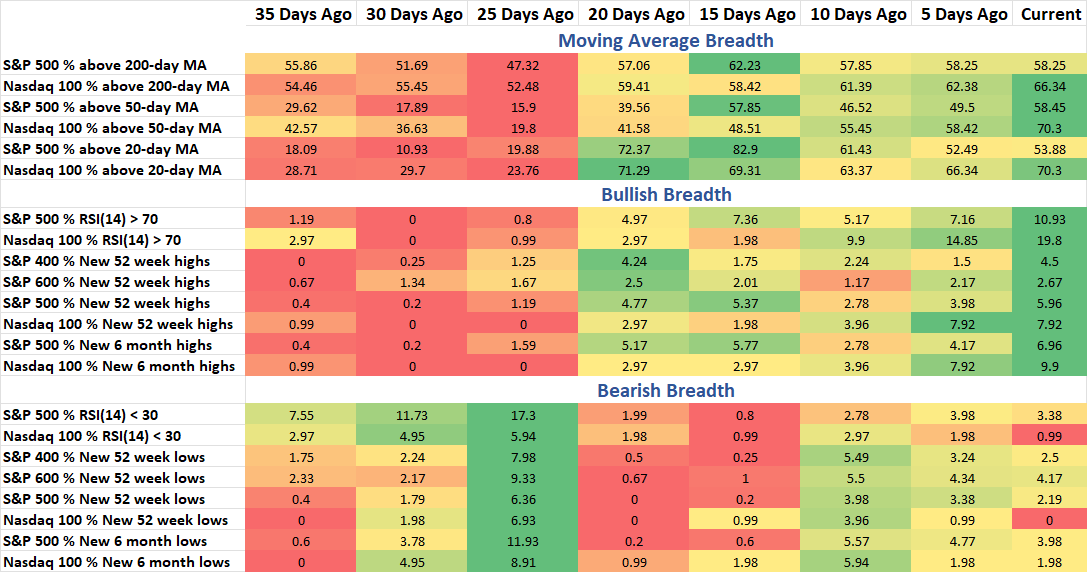
A lot more green on the far-right side of the bullish breadth data section, which is encouraging. But the actual numbers are still a far cry from being robust. less than 6% of large cap, 4.55% of mid cap, and 2.6% of small caps are making new highs. While hardly any stocks are confirming what the indices are doing, they aren’t going down either. There hasn’t been expansion of bearish data yet, keeping the lid on the market truly breaking down.
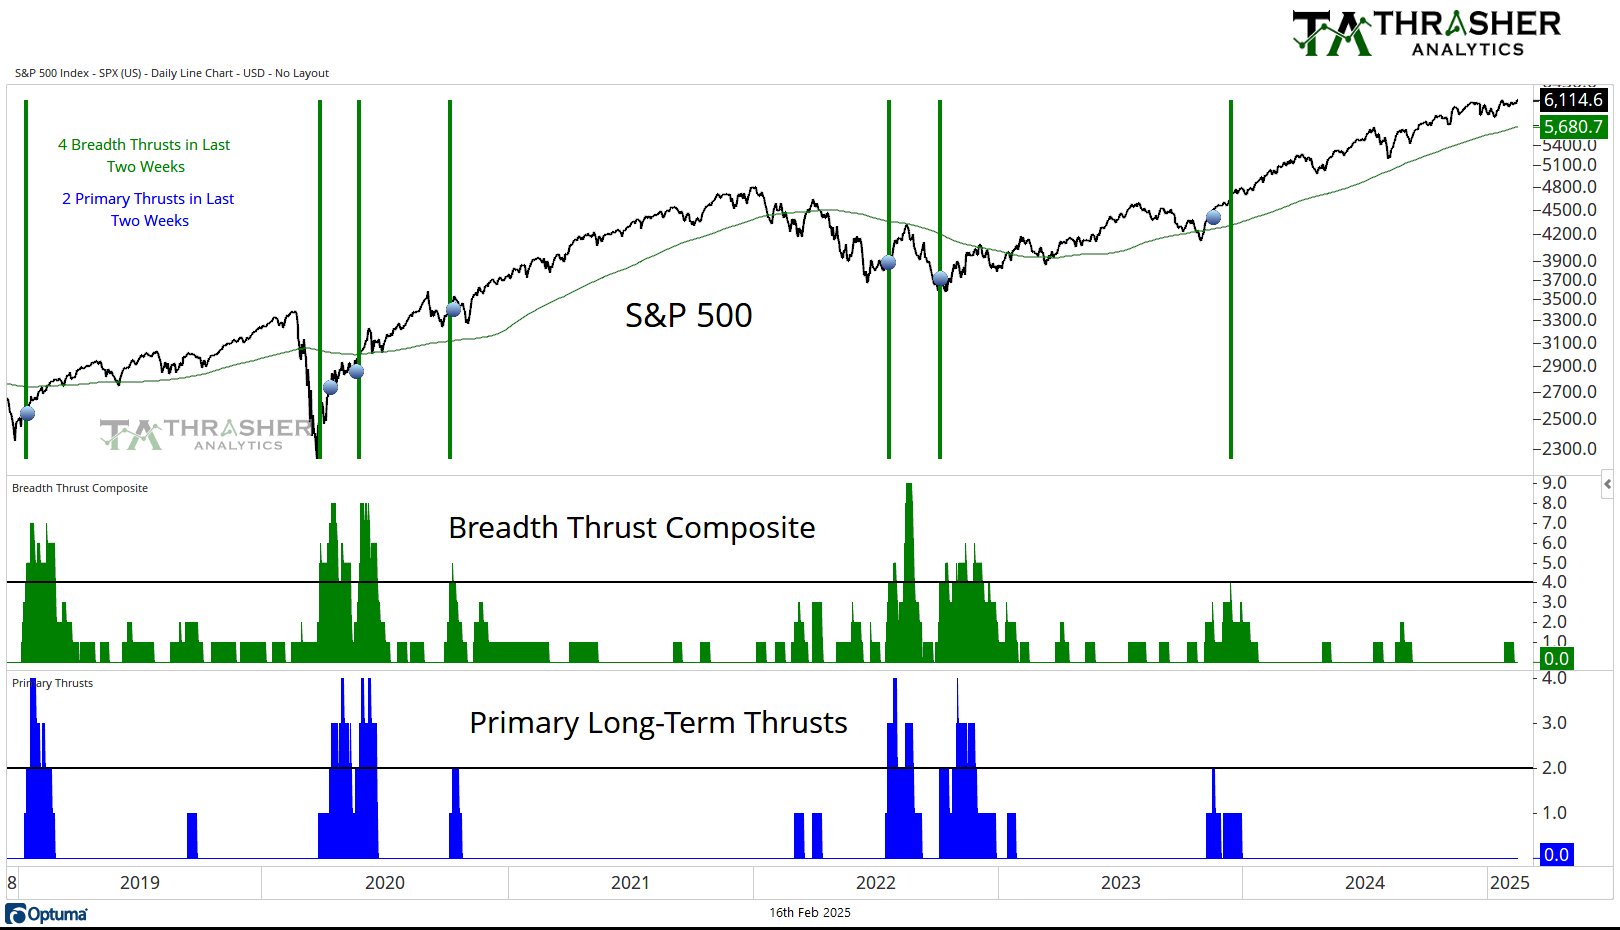
Breadth Thrust Composite
A collection of multiple breadth thrust indicators based on different indices that incorporate price and volume to mark when extremely strong buying activity is taking place by the movement of individual stocks. When multiple of these thrusts occur in a short period of time, the reaction in the S&P 500 has historically been positive going forward.
Breadth Thrust Composite is at 0.
Keep reading with a 7-day free trial
Subscribe to Thrasher Analytics to keep reading this post and get 7 days of free access to the full post archives.