

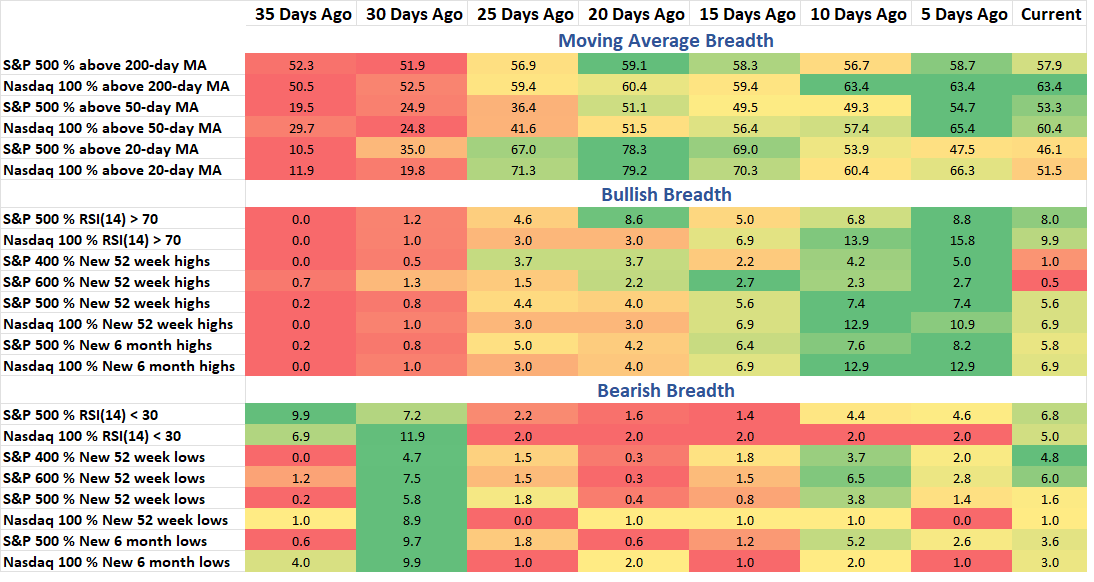
The 52 week low and high data for mid and small caps stands out like a red thumb. Breadth for smaller cap stocks is weak and matches what price is showing as small caps are down over -10% from their highs. Looking below the surface, we have a lot more stocks down 5 or 10% than are up by that much, nearing a key threshold. Also, the breadth picture for offense sectors is deteriorating relative to defensive sectors.
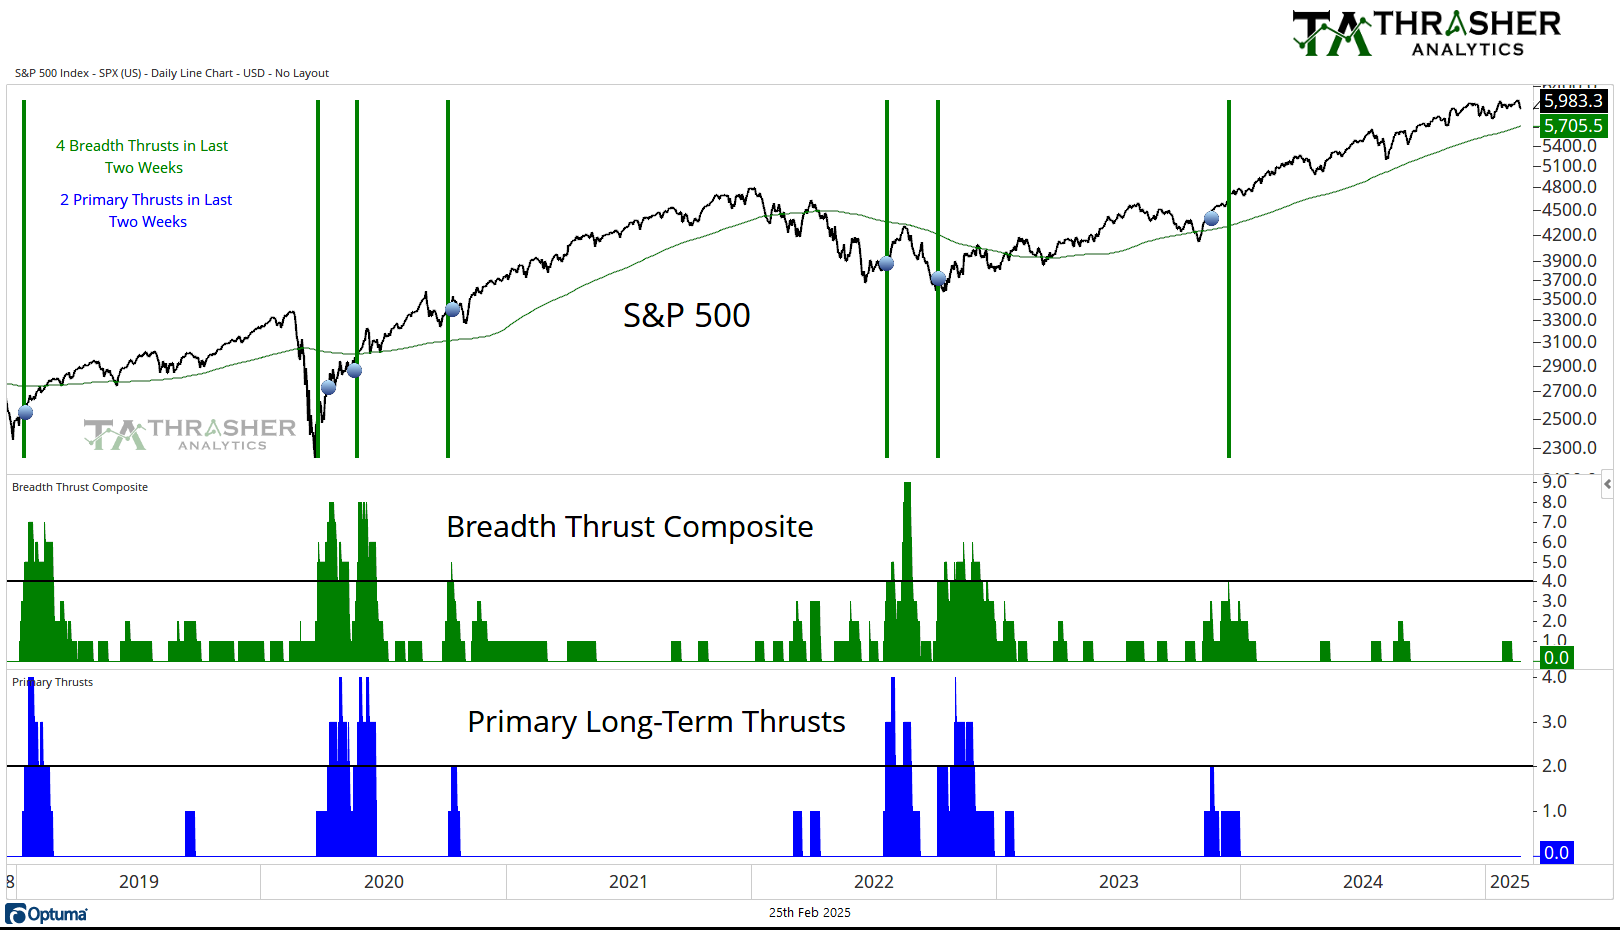
Breadth Thrust Composite
A collection of multiple breadth thrust indicators based on different indices that incorporate price and volume to mark when extremely strong buying activity is taking place by the movement of individual stocks. When multiple of these thrusts occur in a short period of time, the reaction in the S&P 500 has historically been positive going forward.
Breadth Thrust Composite is at 0.
Keep reading with a 7-day free trial
Subscribe to Thrasher Analytics to keep reading this post and get 7 days of free access to the full post archives.