

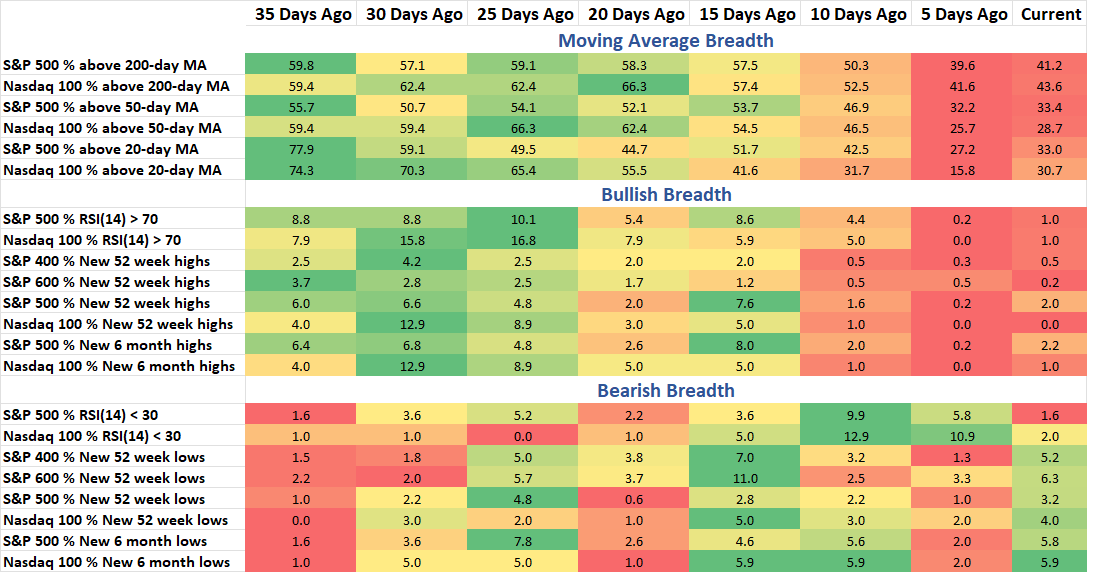
Still a lot of red in that Bullish Breadth far right set of rows. The Index has bounced but we are still near the lows from a breadth perspective. Most stocks (like the SPX) are negative YTD and 58% are below their long-term moving average. The one positive is we still aren’t seeing expansion in bearish breadth, as discussed last week with the example of net-52-week highs. Last week ended on a whisper as far as individual stocks were concerned. Few were able to move higher and even less were able to keep up with the S&P 500.
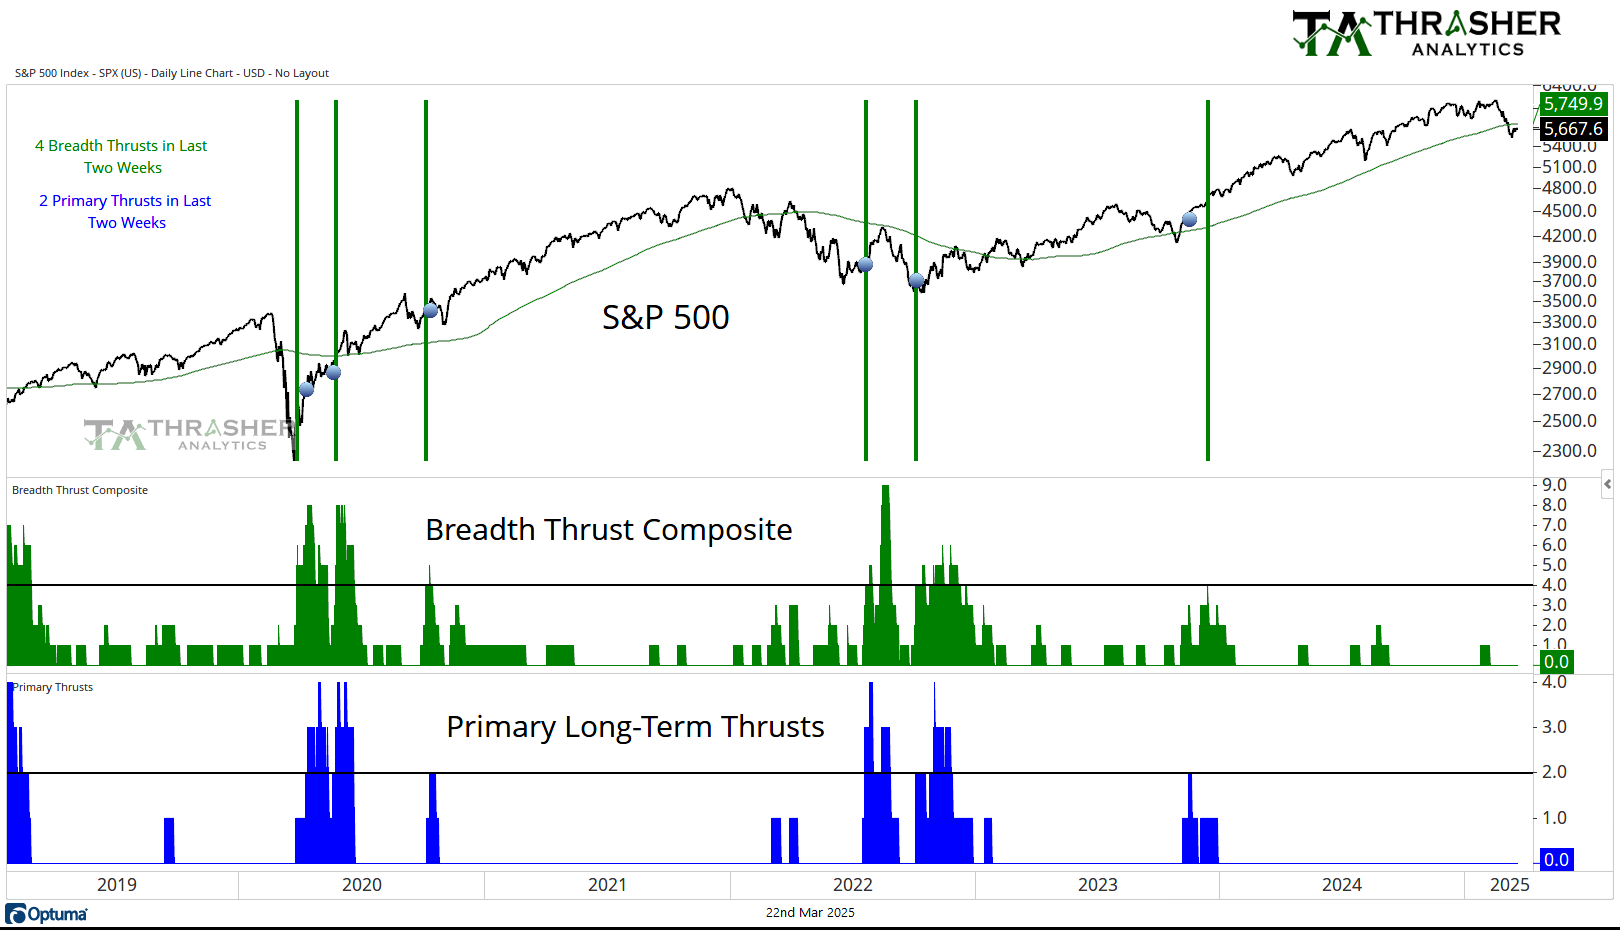
Breadth Thrust Composite
A collection of multiple breadth thrust indicators based on different indices that incorporate price and volume to mark when extremely strong buying activity is taking place by the movement of individual stocks. When multiple of these thrusts occur in a short period of time, the reaction in the S&P 500 has historically been positive going forward.
Breadth Thrust Composite is at 0.
Keep reading with a 7-day free trial
Subscribe to Thrasher Analytics to keep reading this post and get 7 days of free access to the full post archives.