

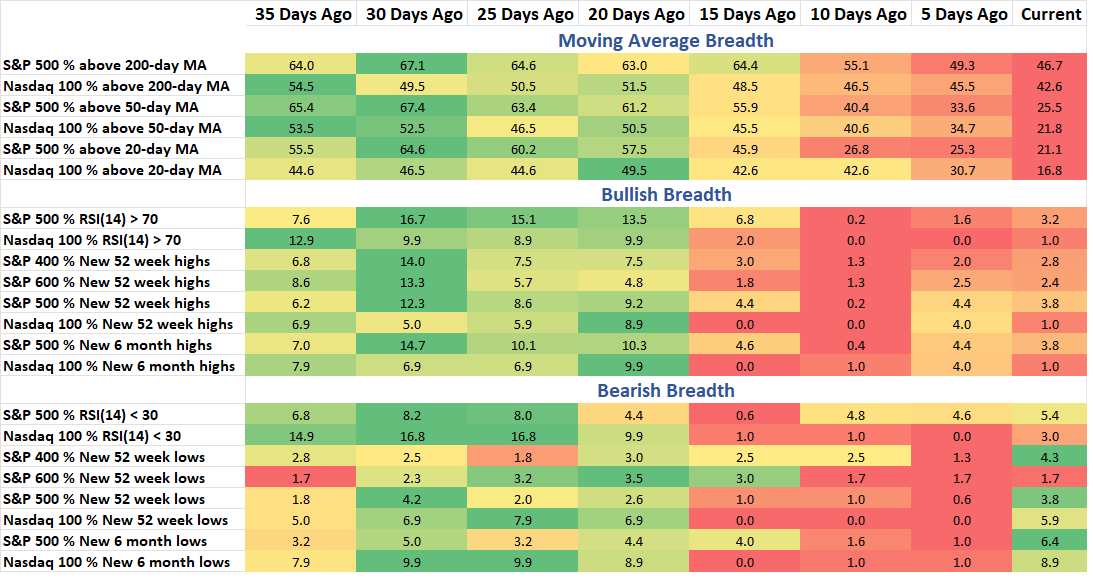
More red in Bullish breadth data with the lowest readings in moving average data. More on the MA topic later in note. Nearly 69% of stocks are down 10% or more and 37% are off their highs by 20% or more. Friday saw just over 11% of stocks make a multi-month new low, a significant number but not quite to a threshold that lines up with other major declines.
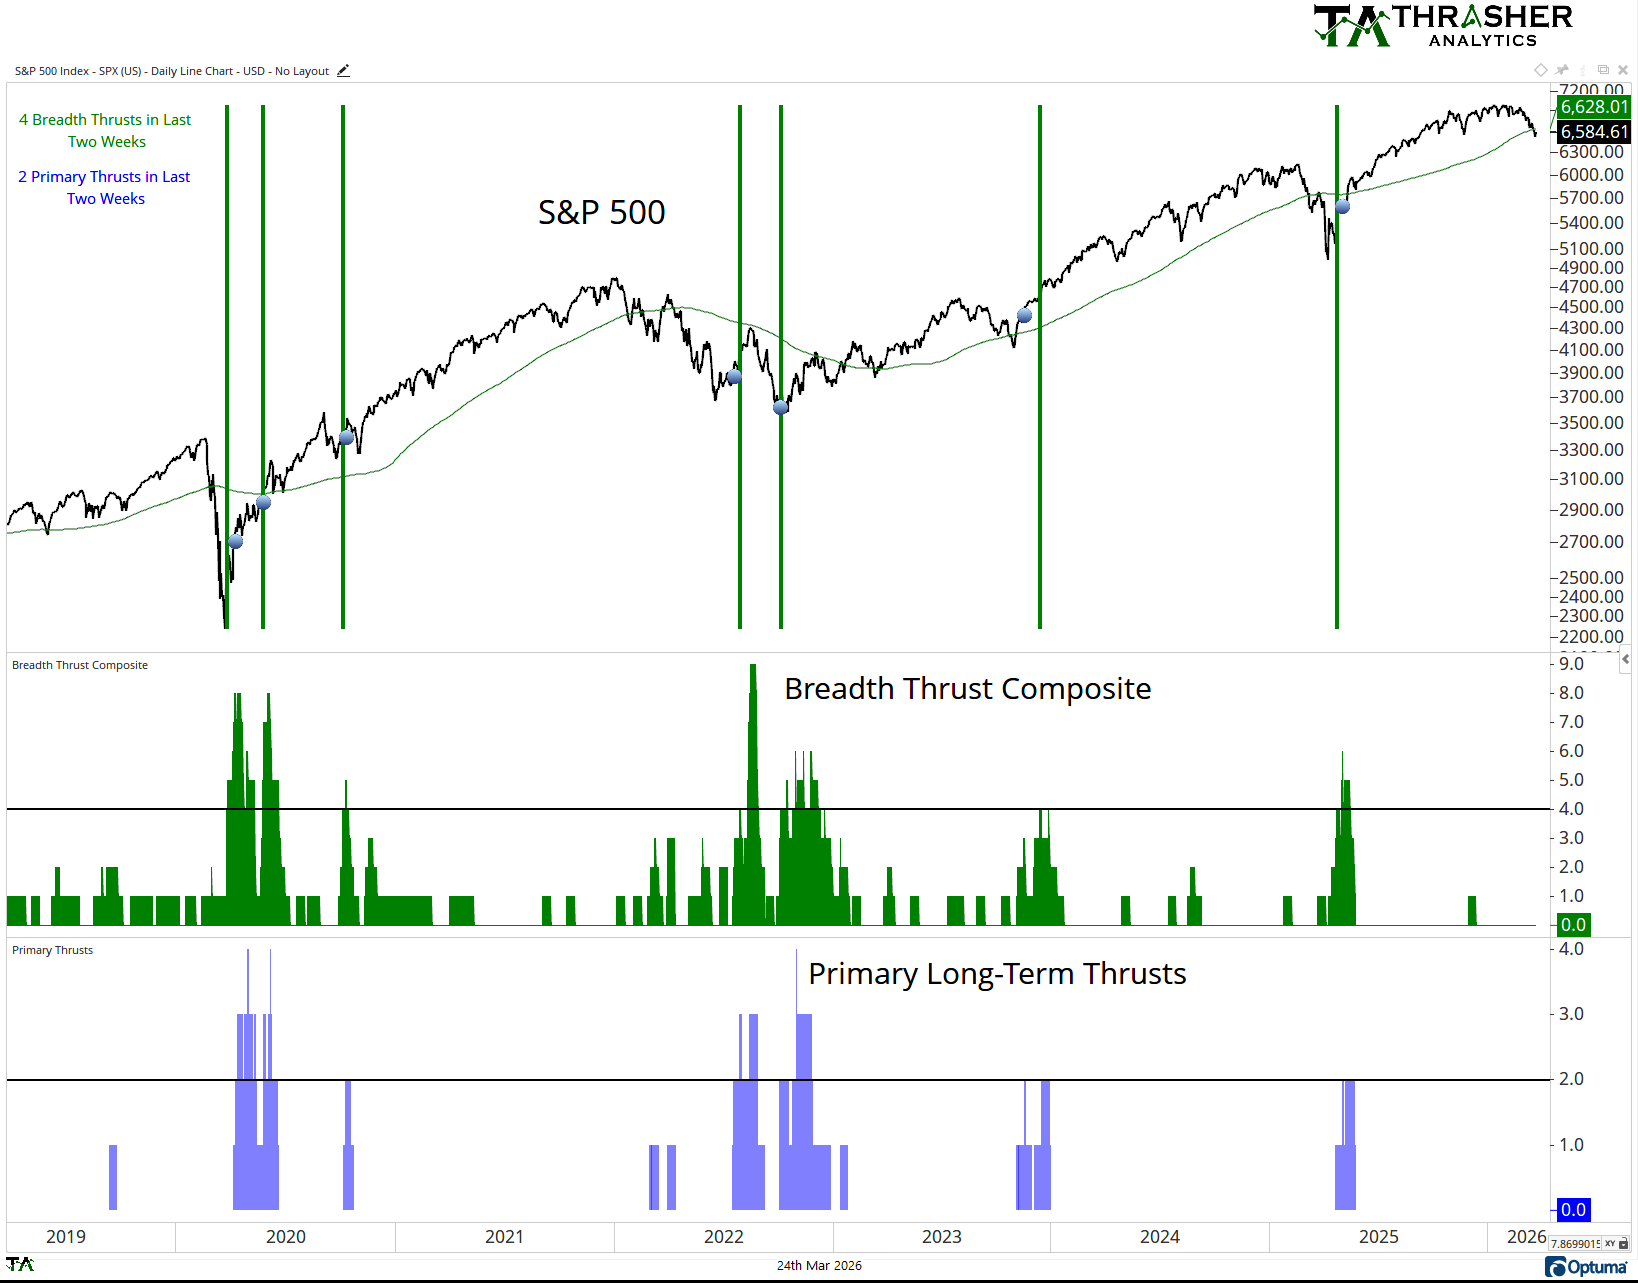
Breadth Thrust Composite
A collection of multiple breadth thrust indicators based on different indices that incorporate price and volume to mark when extremely strong buying activity is taking place by the movement of individual stocks. When multiple of these thrusts occur in a short period of time, the reaction in the S&P 500 has historically been positive going forward.
Breadth Thrust Composite is at 0.
Keep reading with a 7-day free trial
Subscribe to Thrasher Analytics to keep reading this post and get 7 days of free access to the full post archives.