

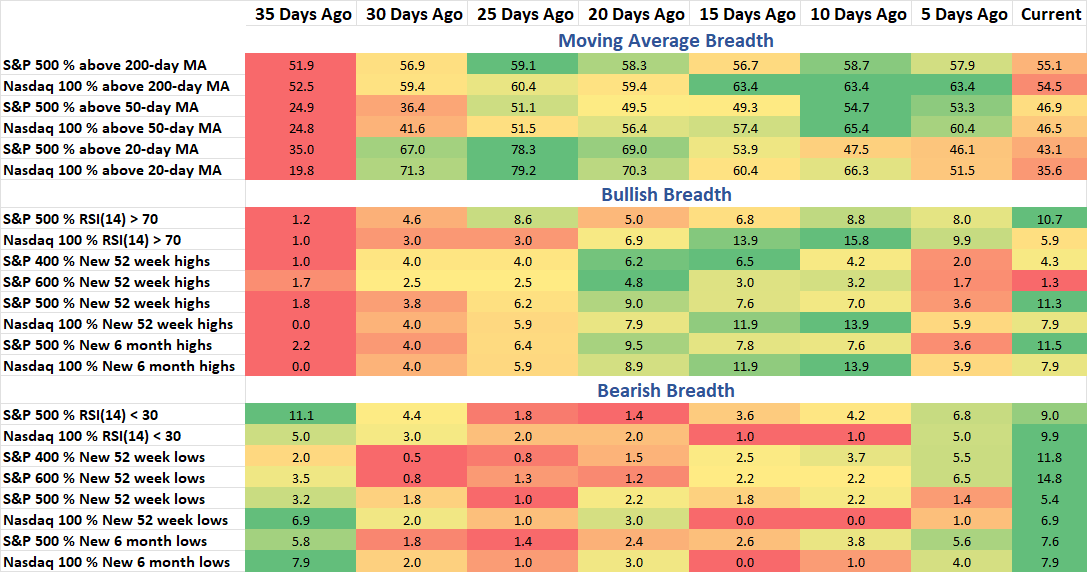
On Tuesday the S&P 500 and Nasdaq 100 approached their respective 200-day moving averages. Buyers stepped in after lunch to attempt to buy the dip, we’ll see if it holds but it makes sense to see this key moving average be respected by price on its first test. Below the surface, we still have stocks selling off. Mid and Small caps have double digit 52-week low lists. And there’s an awful lot of green in the Bearish Breadth section of the Breadth Stats table below. Later in the note I dig into the drawdown data for the S&P 500 and Nasdaq 100.
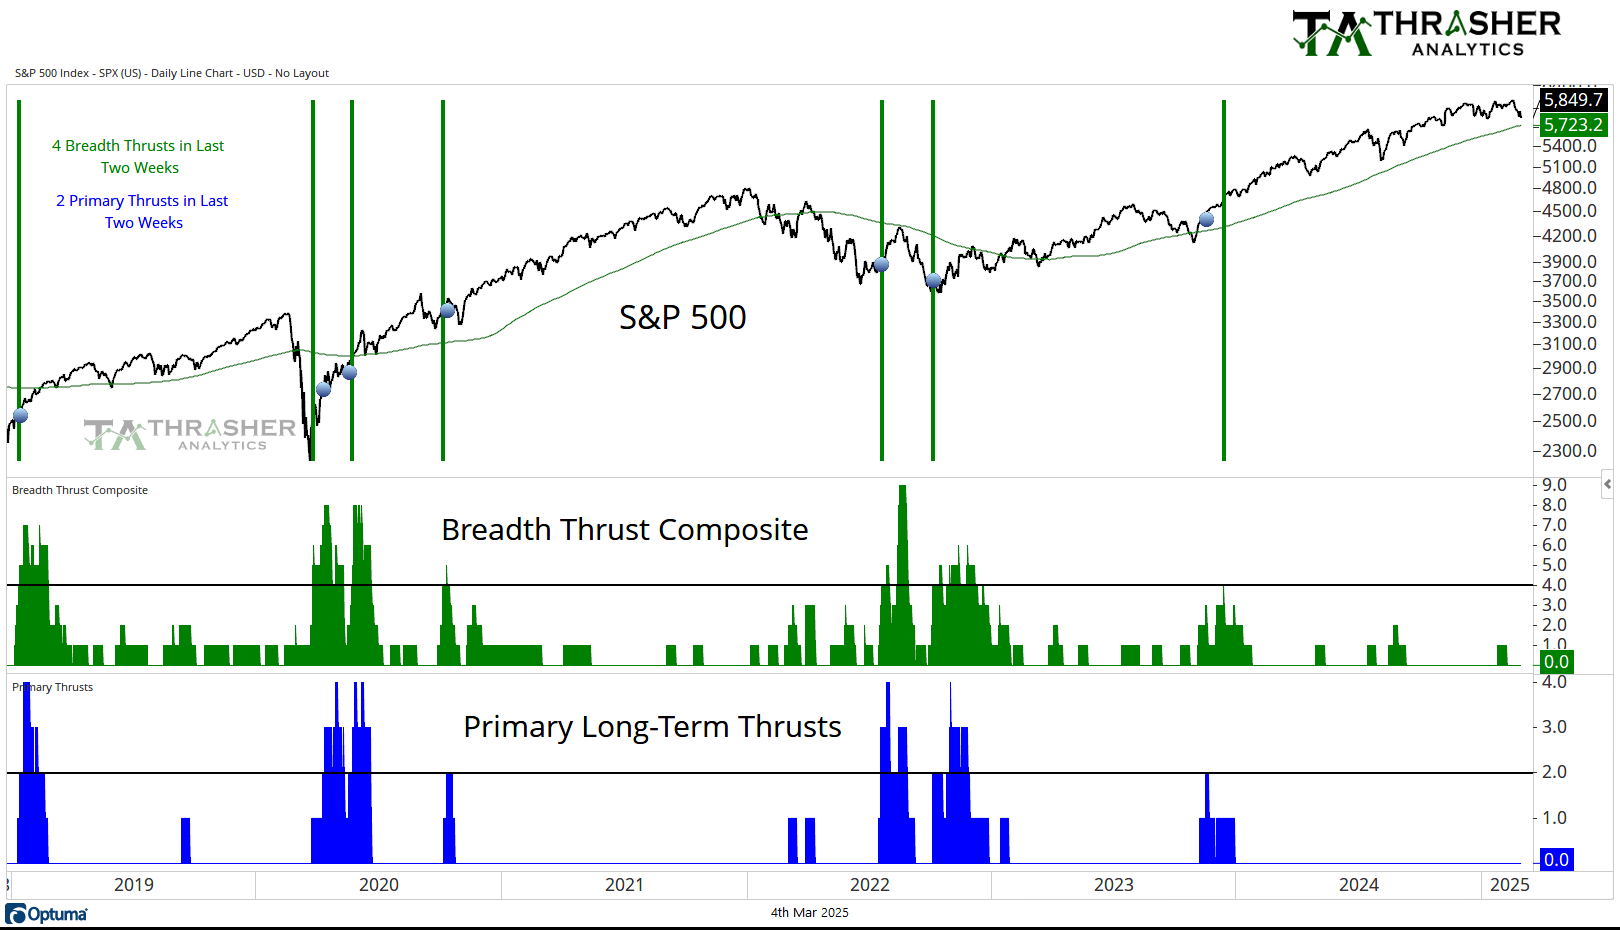
Breadth Thrust Composite
A collection of multiple breadth thrust indicators based on different indices that incorporate price and volume to mark when extremely strong buying activity is taking place by the movement of individual stocks. When multiple of these thrusts occur in a short period of time, the reaction in the S&P 500 has historically been positive going forward.
Breadth Thrust Composite is at 0.
Keep reading with a 7-day free trial
Subscribe to Thrasher Analytics to keep reading this post and get 7 days of free access to the full post archives.