

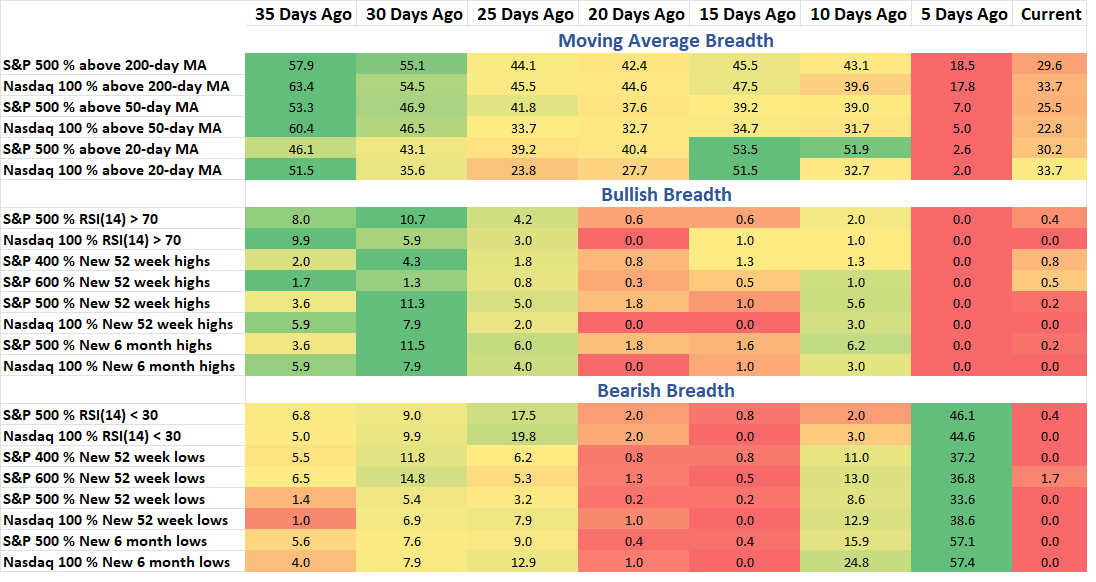
The market is off its lows and so is the breadth data. It is interesting to observe that the bearish breadth data went from the highest levels in over a month to some of the lowest the following week. The market is moving fast and one of the charts below shows that, looking at net new highs. This week’s breadth note also looks at the breadth data of sectors and what that’s telling us from which sectors are showing the strongest (or least weak?) breadth readings right now.
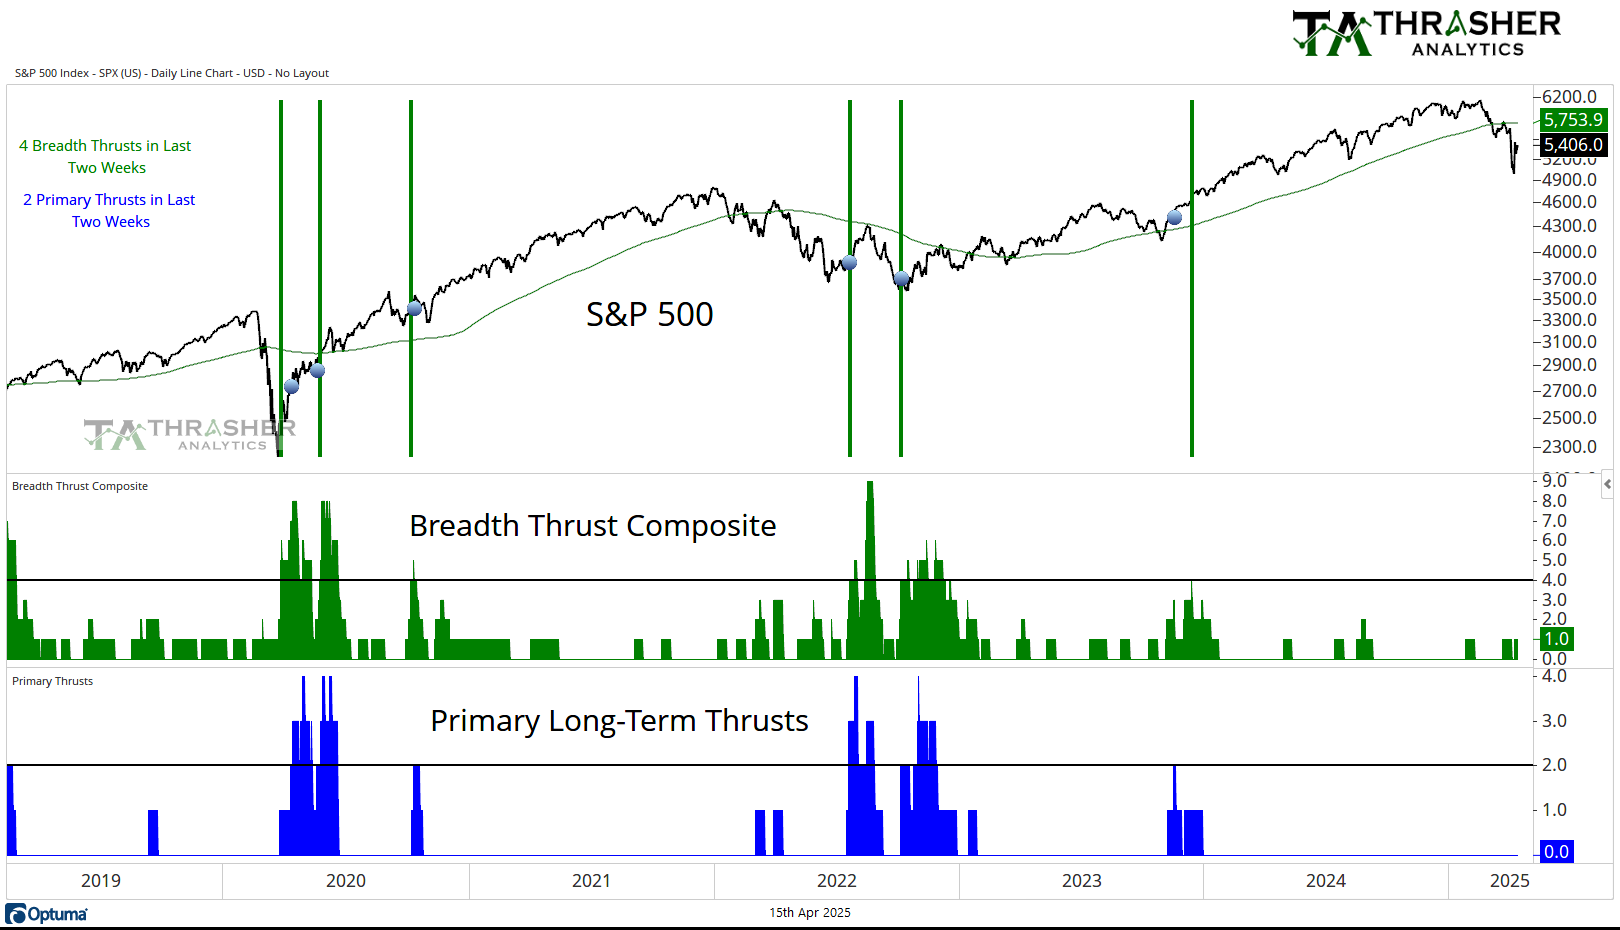
Breadth Thrust Composite
A collection of multiple breadth thrust indicators based on different indices that incorporate price and volume to mark when extremely strong buying activity is taking place by the movement of individual stocks. When multiple of these thrusts occur in a short period of time, the reaction in the S&P 500 has historically been positive going forward.
Breadth Thrust Composite is at +1.
Keep reading with a 7-day free trial
Subscribe to Thrasher Analytics to keep reading this post and get 7 days of free access to the full post archives.