


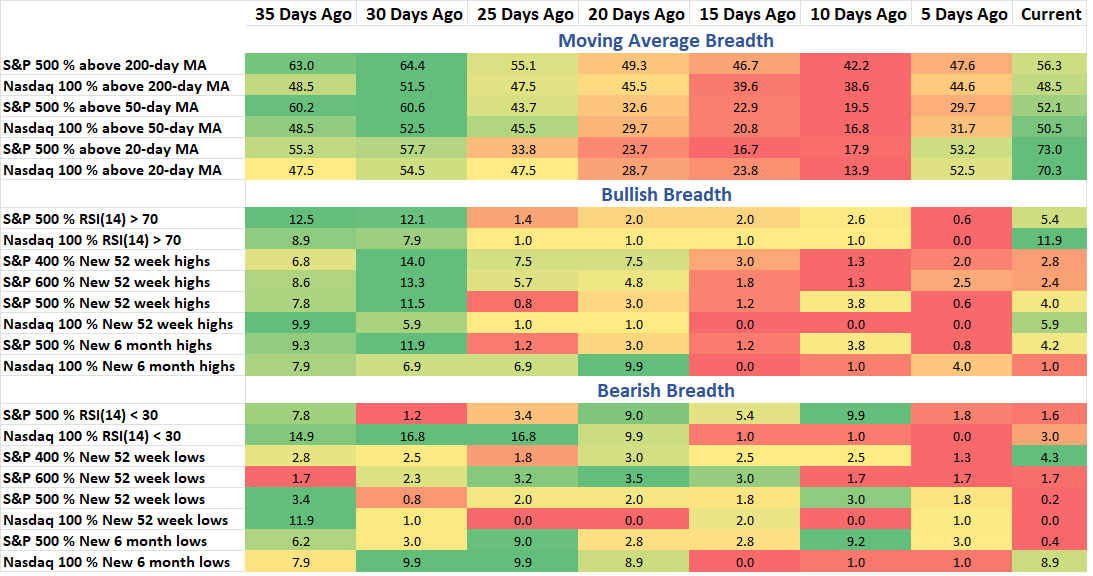
The S&P 500 hit a new all-time high today (Weds.) and coming into this day there hadn’t been a lot of stocks ‘frontrunning’ that achievement. By the close today just 45% of large cap stocks were up, again not a huge stamp of confirmation just yet. We did see the S&P 600 made a new high on Tuesday but along with mid-caps, pulled back today. This has been a very fast recovery in U.S. equities. In fact, I shared on Twitter/X that only two prior times has the 14-period RSI for the S&P 500 gone from under 30 to over 70 in just 15 days. It hasn’t happened today yet, but the momentum indicator is less than two points away. Breadth has been improving and there has been an uptick in Breadth Thrusts; we’ll see if that continues to improve and participation broadens as more stocks (hopefully) rise in performance.
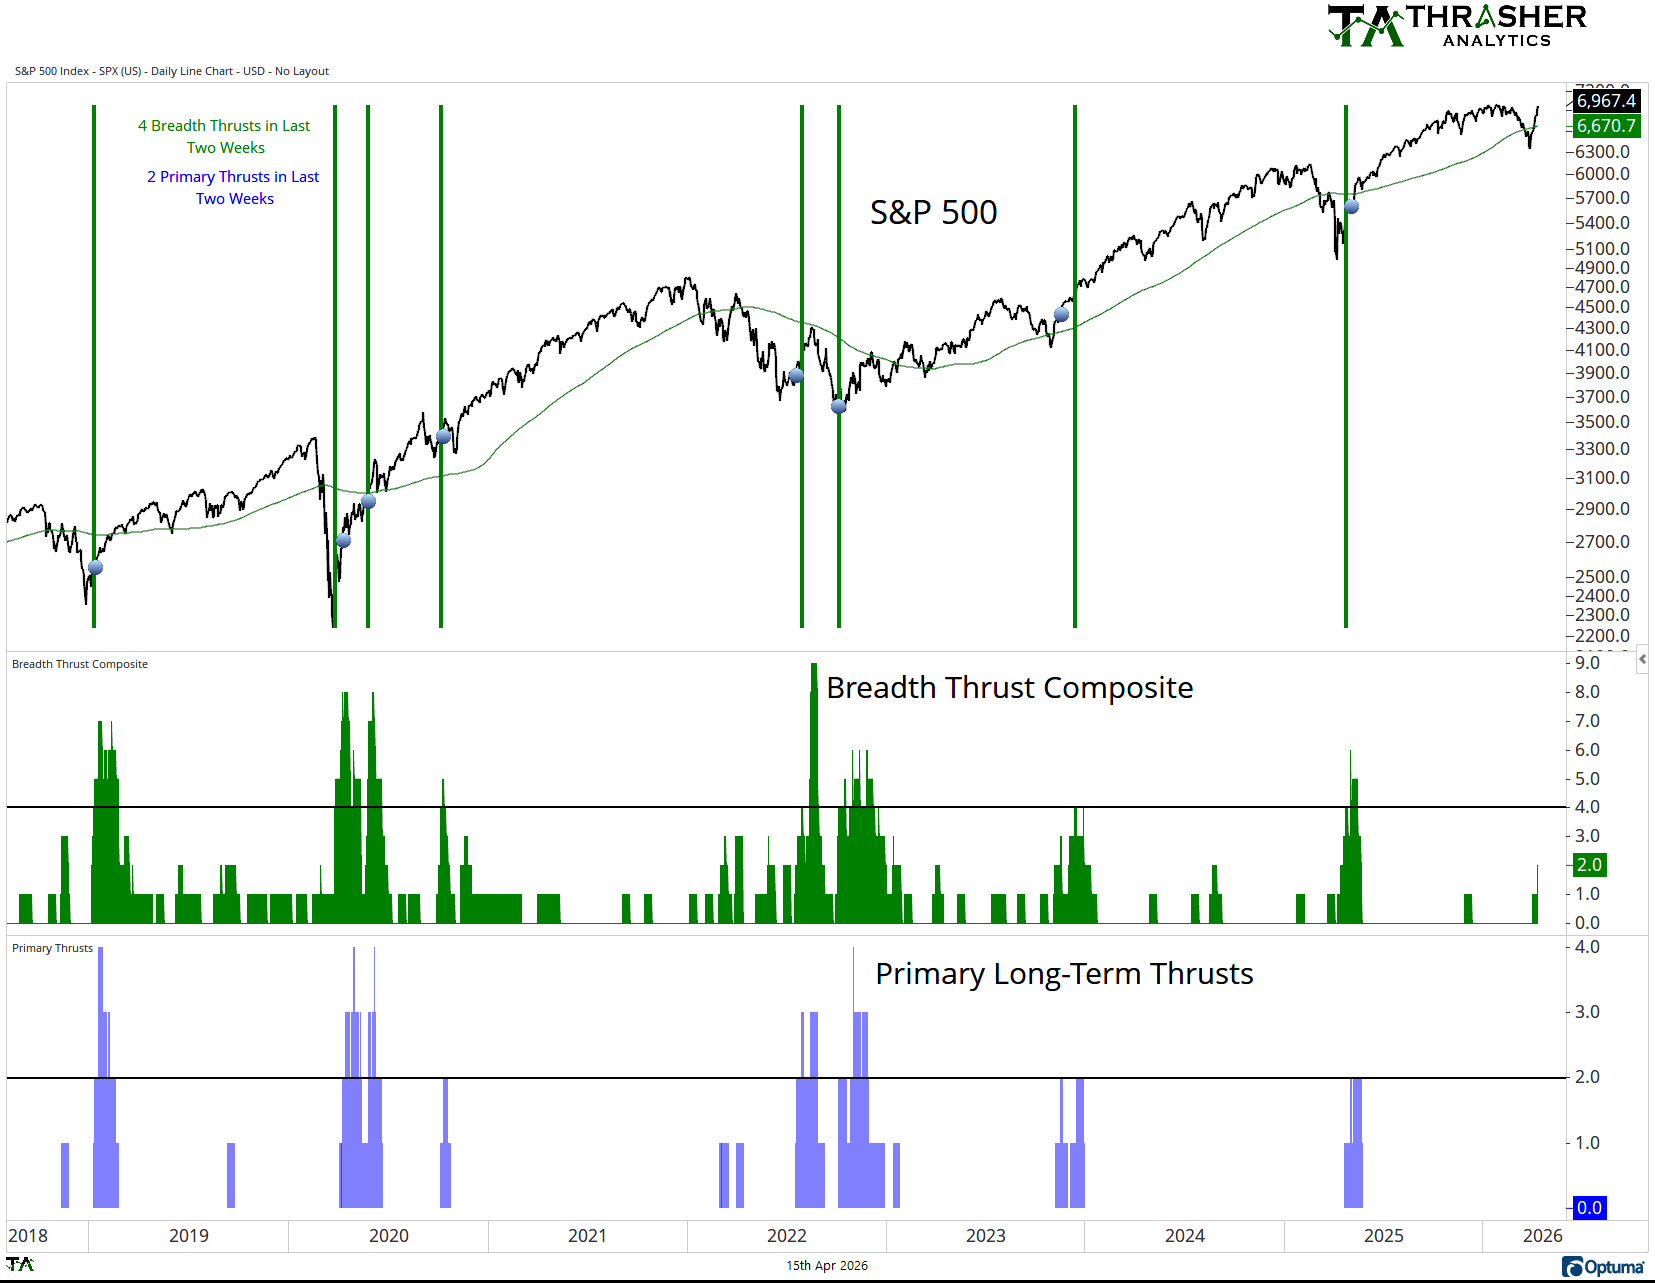
Breadth Thrust Composite
A collection of multiple breadth thrust indicators based on different indices that incorporate price and volume to mark when extremely strong buying activity is taking place by the movement of individual stocks. When multiple of these thrusts occur in a short period of time, the reaction in the S&P 500 has historically been positive going forward.
Breadth Thrust Composite is at +2.
Keep reading with a 7-day free trial
Subscribe to Thrasher Analytics to keep reading this post and get 7 days of free access to the full post archives.