

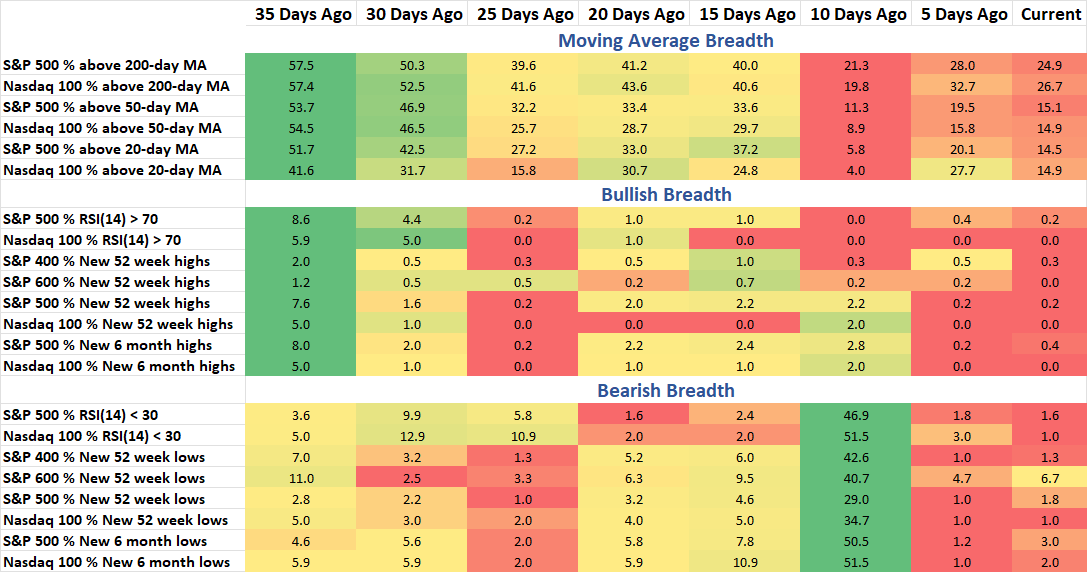
The S&P 500 remains off its low but its counter-trend is put into question as it’s unable to break the 20-day moving average. Which lines up with most stocks, as just 14.5% are above their short-term average as of Monday’s close. Just one sector has the majority of its stocks in up trends (above 200MA) and two sectors are sitting with their breadth data at the lows of the month. While the Index has been in a down trend, we’ve seen quite a few stocks show outperformance, one chart in tonight’s note looks at the 20-day average of this data and how it’s now showing we could see a shift back to cap weight strength and away from smaller cap equities.
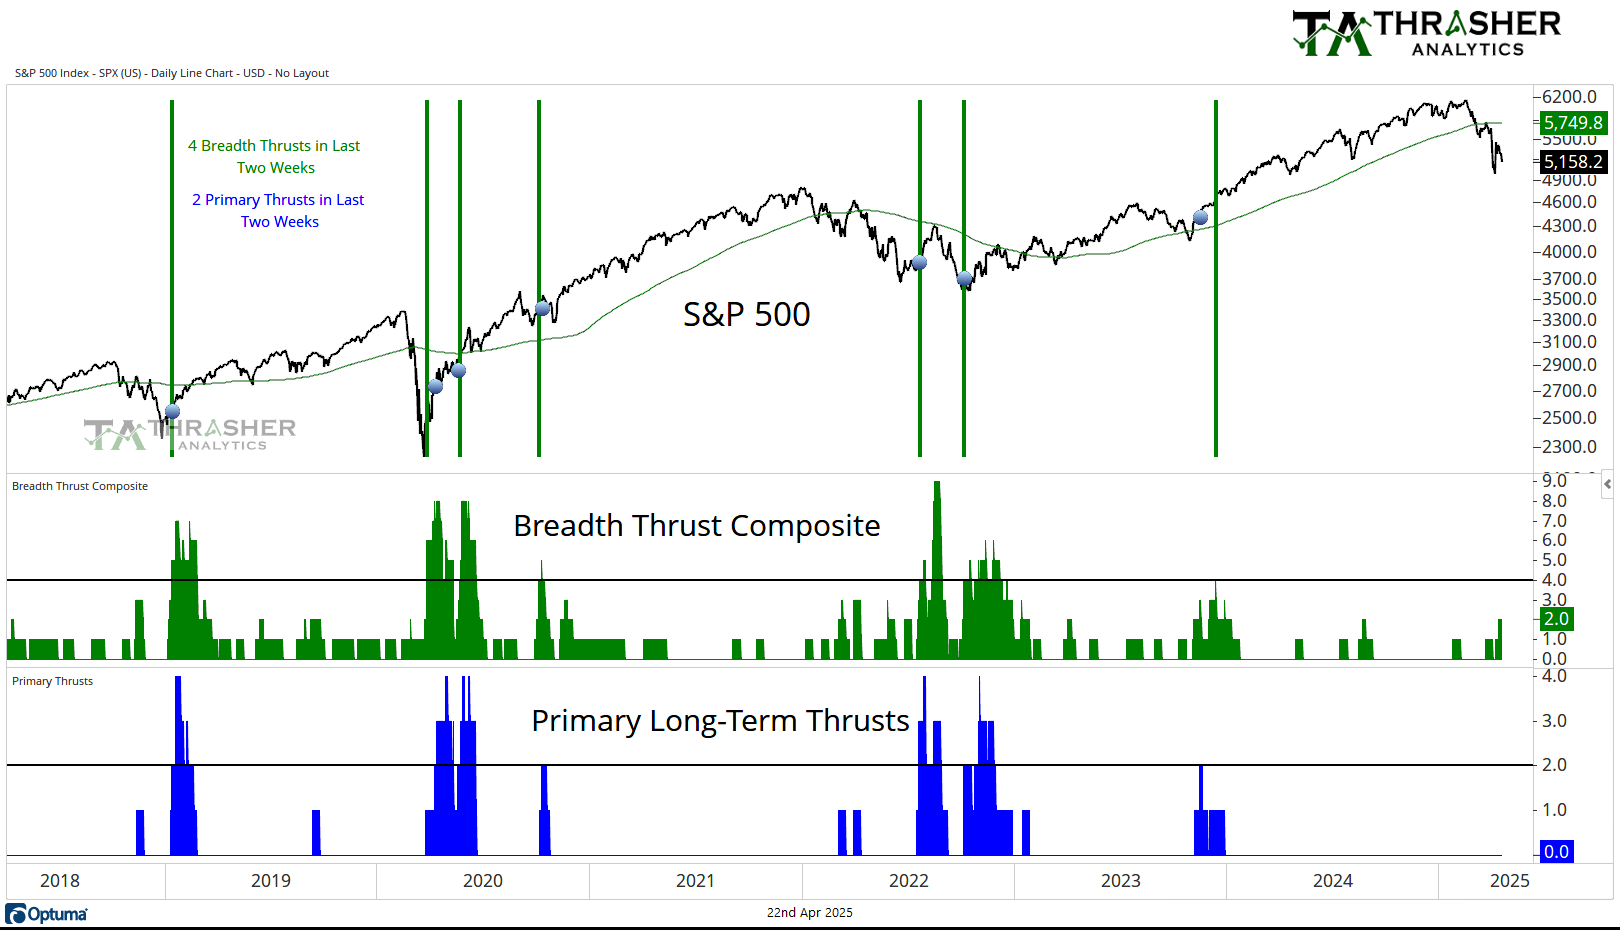
Breadth Thrust Composite
A collection of multiple breadth thrust indicators based on different indices that incorporate price and volume to mark when extremely strong buying activity is taking place by the movement of individual stocks. When multiple of these thrusts occur in a short period of time, the reaction in the S&P 500 has historically been positive going forward.
Breadth Thrust Composite is at +2.
Keep reading with a 7-day free trial
Subscribe to Thrasher Analytics to keep reading this post and get 7 days of free access to the full post archives.