

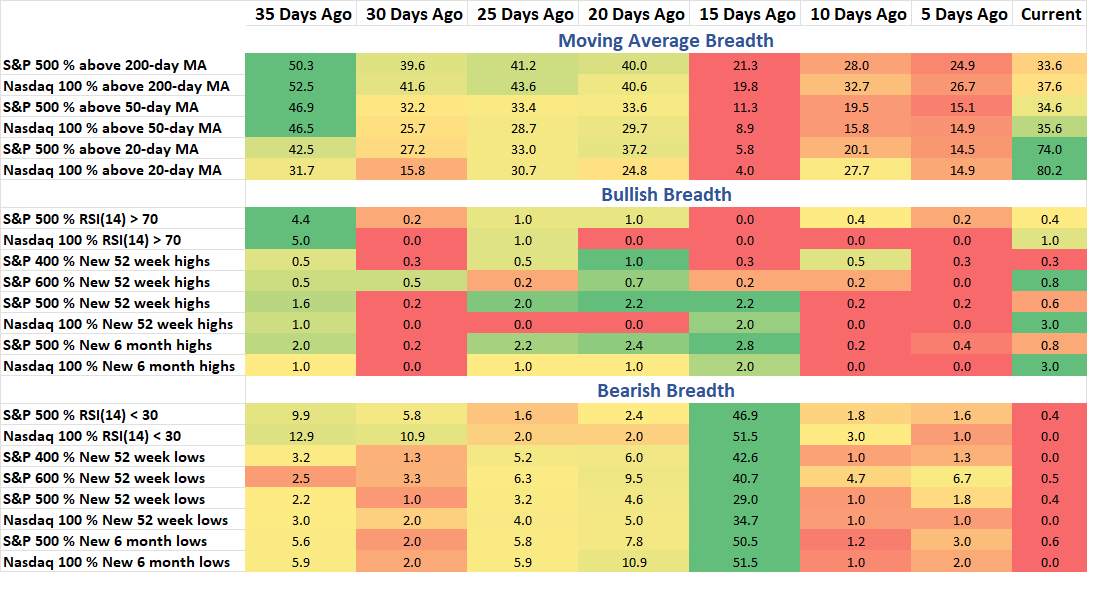
Back to seeing some green show up in the Bullish Breadth data. Although it’s readings under 1%, it’s the greatest number of stocks hitting new highs across indices in the last 35 days. This week’s breadth note shows why it’s important to understand how individual stocks are trending higher and lower. I also show a unique chart that evaluates new highs and lows but not on a daily basis and why that’s mattered in the past.
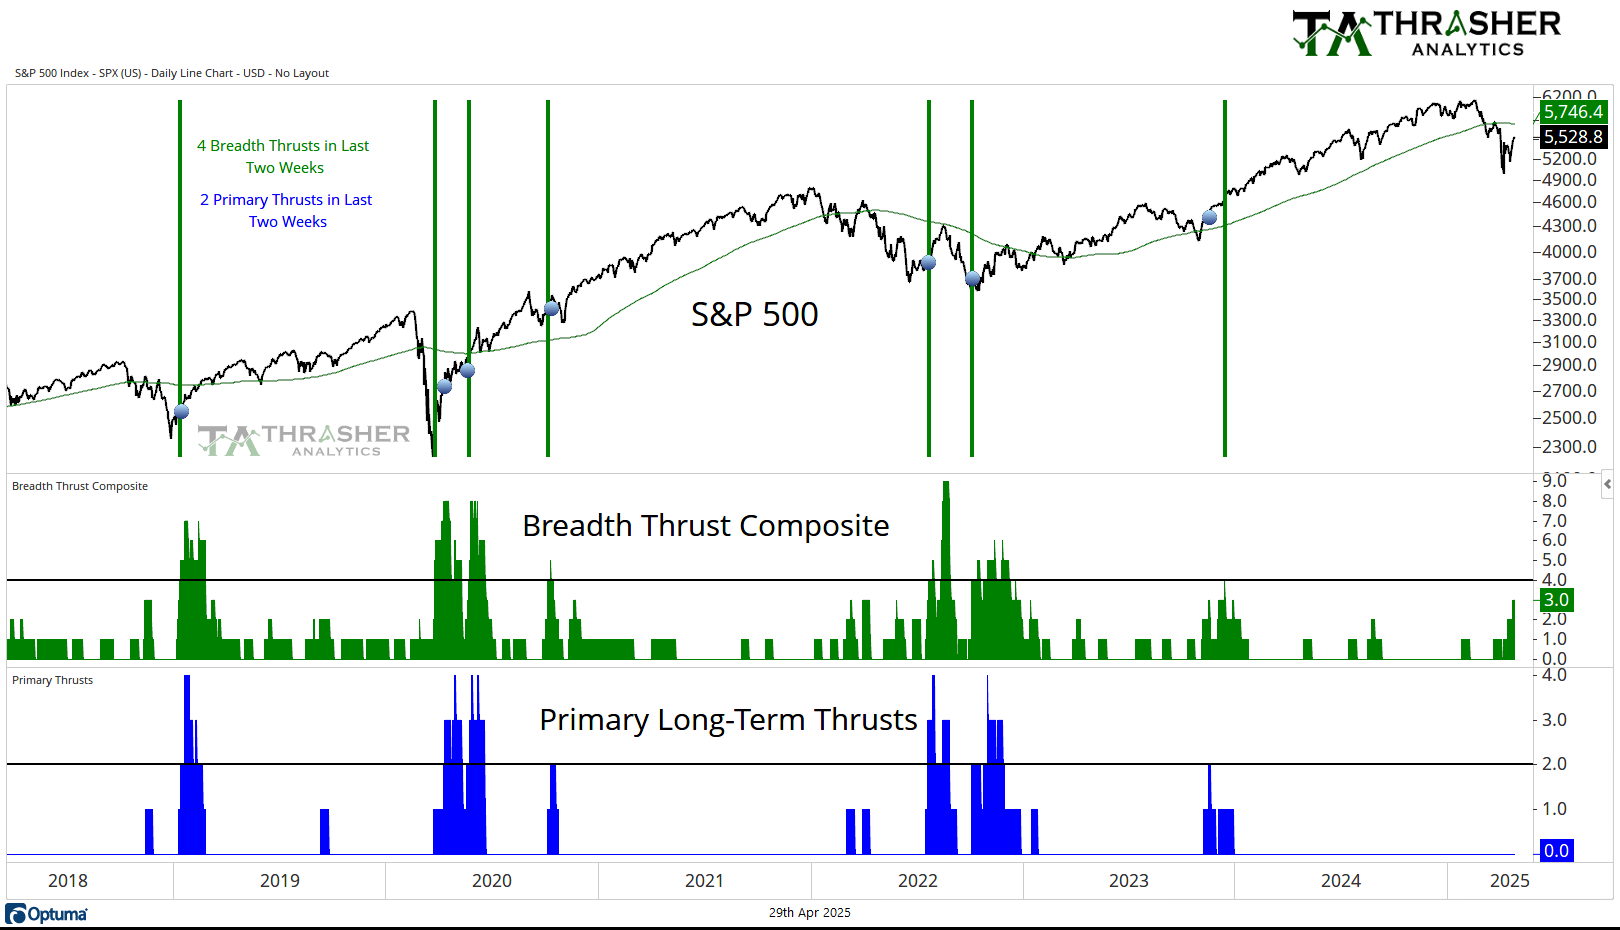
Breadth Thrust Composite
A collection of multiple breadth thrust indicators based on different indices that incorporate price and volume to mark when extremely strong buying activity is taking place by the movement of individual stocks. When multiple of these thrusts occur in a short period of time, the reaction in the S&P 500 has historically been positive going forward.
Breadth Thrust Composite is at +3. There’s been a lot of talk about the Zweig Breadth Thrust. This is one of the Thrusts in my composite, but my version has not ‘fired’, which is because it uses the NYSE Stock Only data set, instead of the full data set of NYSE listings which includes non-equity assets. While +3 is a positive for the equity market, it’s still below the threshold of +4 and there haven’t been any Primary Long-Term Thrusts at this point.
Keep reading with a 7-day free trial
Subscribe to Thrasher Analytics to keep reading this post and get 7 days of free access to the full post archives.