

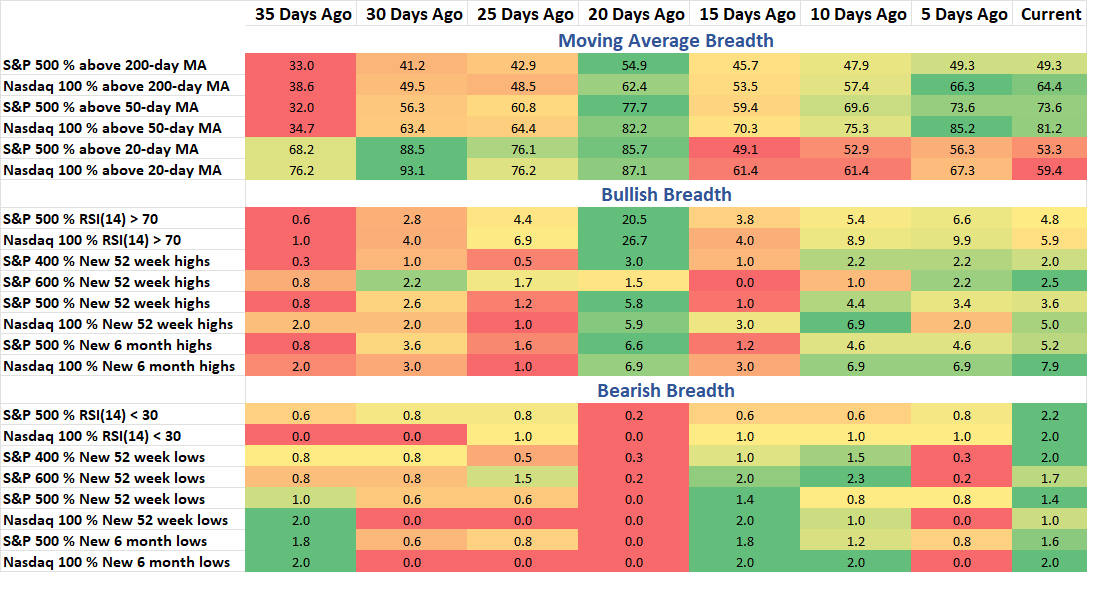
The U.S. equity market is starting to show some signs of pulling back with the SPX falling on Tuesday and about 80% of stocks doing the same during the trading day. This comes after 86% fell on Friday and the short-term breadth data in the table below starting to turn red (% above 20MA) and some green showing up in the bearish data. The S&P 500 is up 7% over the last 3-months (after Monday) but just 40% of stocks are up at least 5% and the net figure is only 18.7%, showing most stocks have struggled to exhibit the same level of strength as shown by the Index.
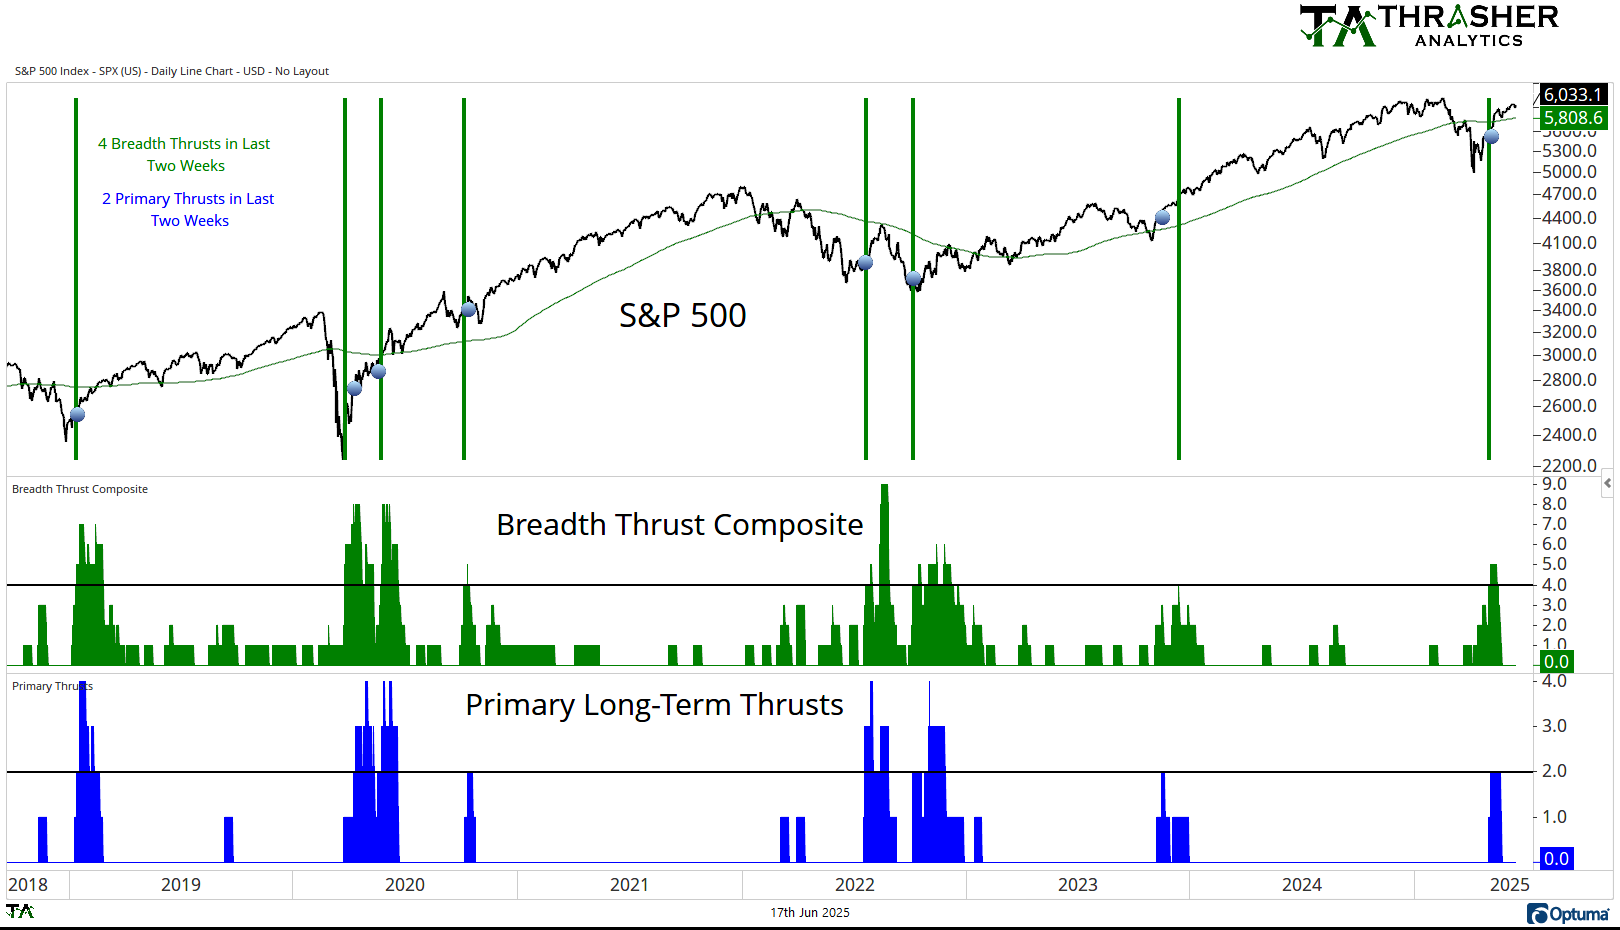
Breadth Thrust Composite
A collection of multiple breadth thrust indicators based on different indices that incorporate price and volume to mark when extremely strong buying activity is taking place by the movement of individual stocks. When multiple of these thrusts occur in a short period of time, the reaction in the S&P 500 has historically been positive going forward.
Breadth Thrust Composite is back to 0.
Keep reading with a 7-day free trial
Subscribe to Thrasher Analytics to keep reading this post and get 7 days of free access to the full post archives.