


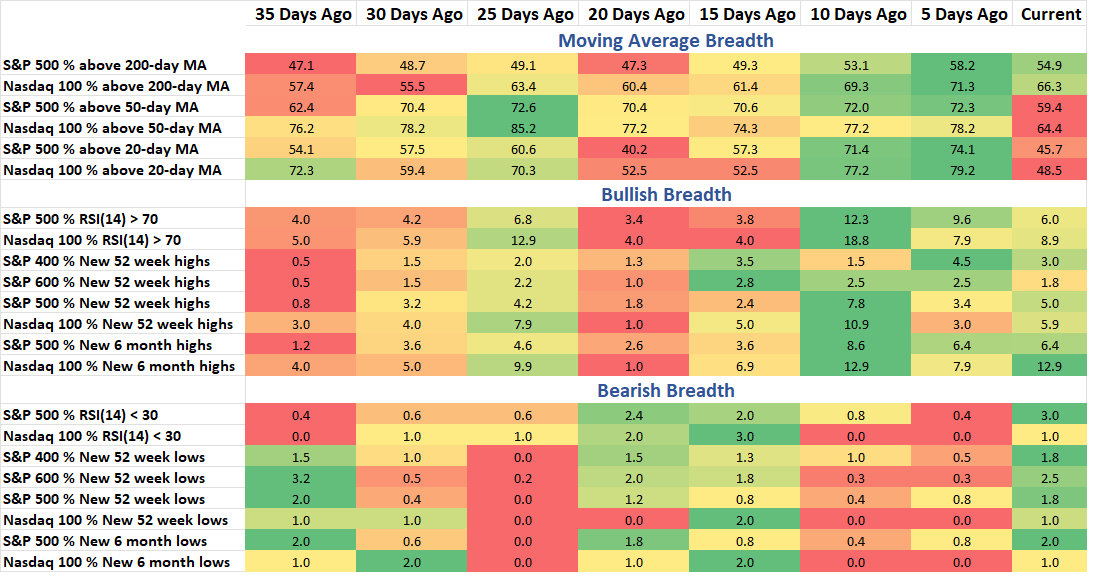
Bullish breadth data has cooled over the last two weeks and while the S&P 500 is less than 1% from an all-time high, many internals have begun to struggle. There’s already 6.4% of stocks hitting a 3-month low and on Tuesday just 16.9% of stocks were able to outperform the Index, one of the lowest readings since the SPX bottomed in April.
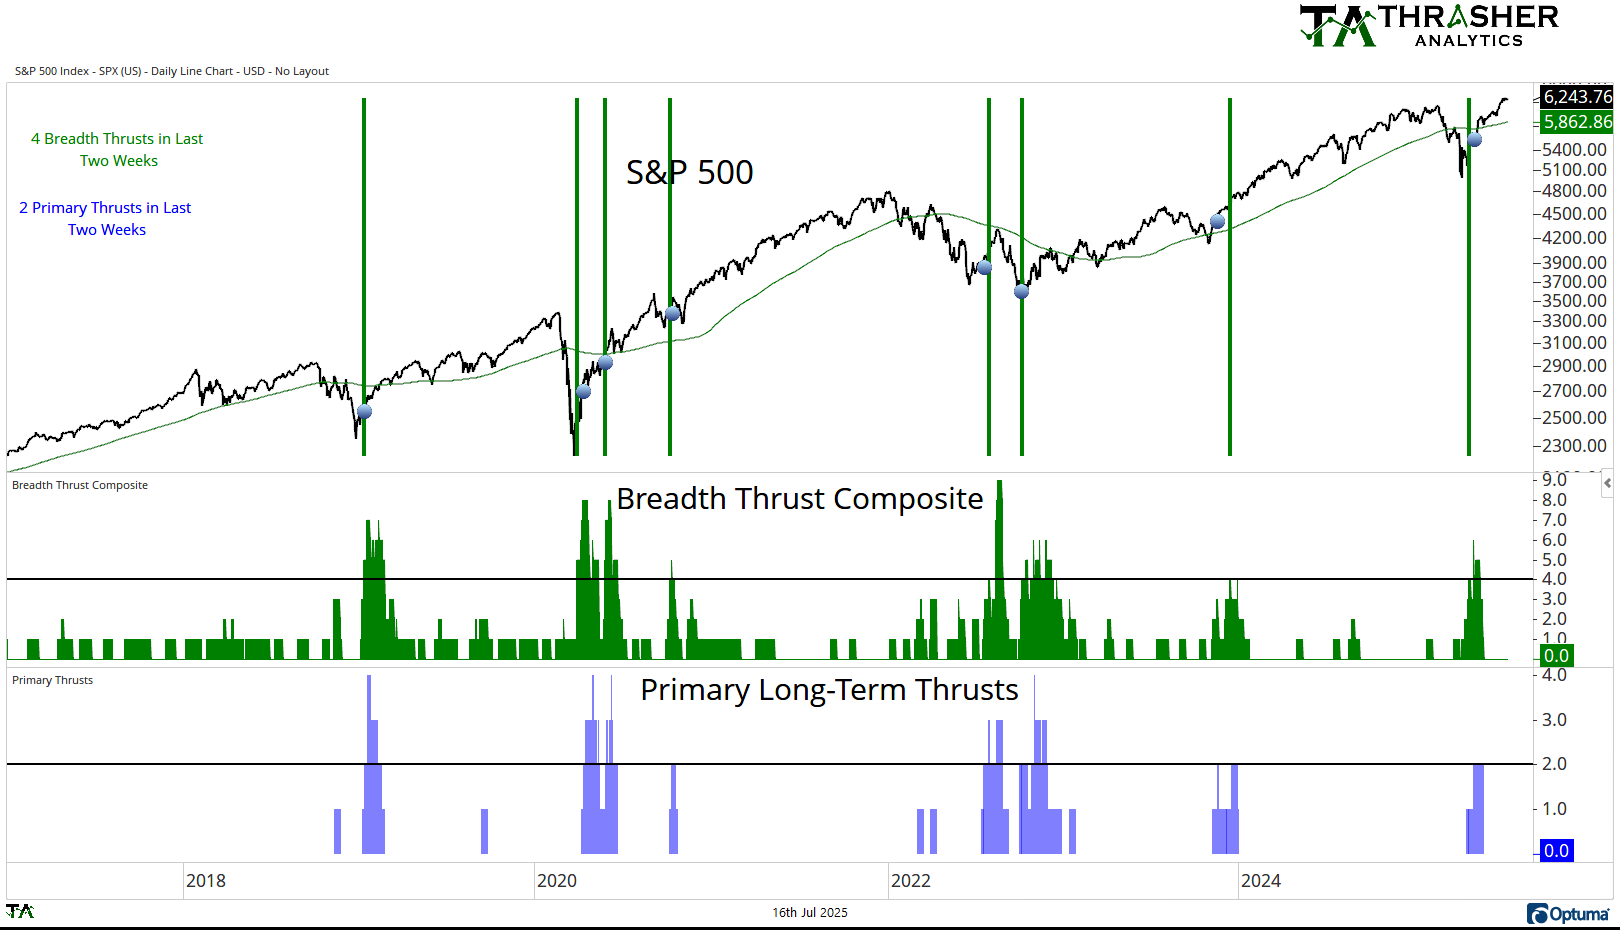
Breadth Thrust Composite
A collection of multiple breadth thrust indicators based on different indices that incorporate price and volume to mark when extremely strong buying activity is taking place by the movement of individual stocks. When multiple of these thrusts occur in a short period of time, the reaction in the S&P 500 has historically been positive going forward.
Breadth Thrust Composite is at 0.
Keep reading with a 7-day free trial
Subscribe to Thrasher Analytics to keep reading this post and get 7 days of free access to the full post archives.