

Breadth Update 7/21/2026
Market Continues to Recover Since March While Mega Caps Are Under Pressure

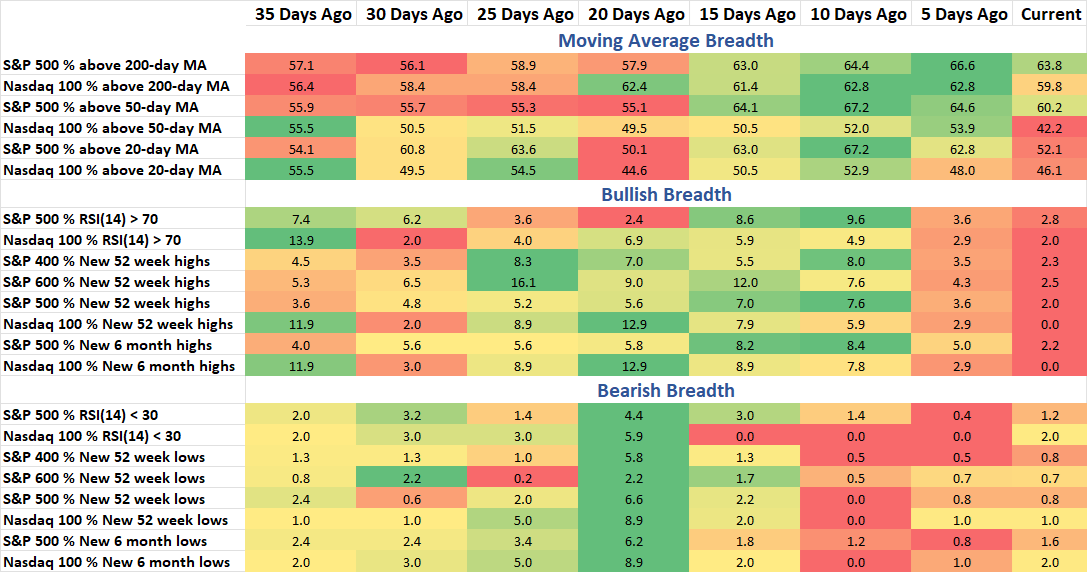
There’s been a recent unwind in the momentum trade and low volatility stocks have flipped the script in relative performance, rising over the last month while high beta stocks move into the red. The selling in South Korean stocks has added some fuel to the fire as tech stocks are under pressure, largely the mega caps. Seeing mostly red in the Bullish Breadth stats in the table below, but under the surface breadth data doesn’t look terrible all considered. In tonight’s note, I show how YTD stats have held up well for most of the market and stocks continue to recover since the March low.
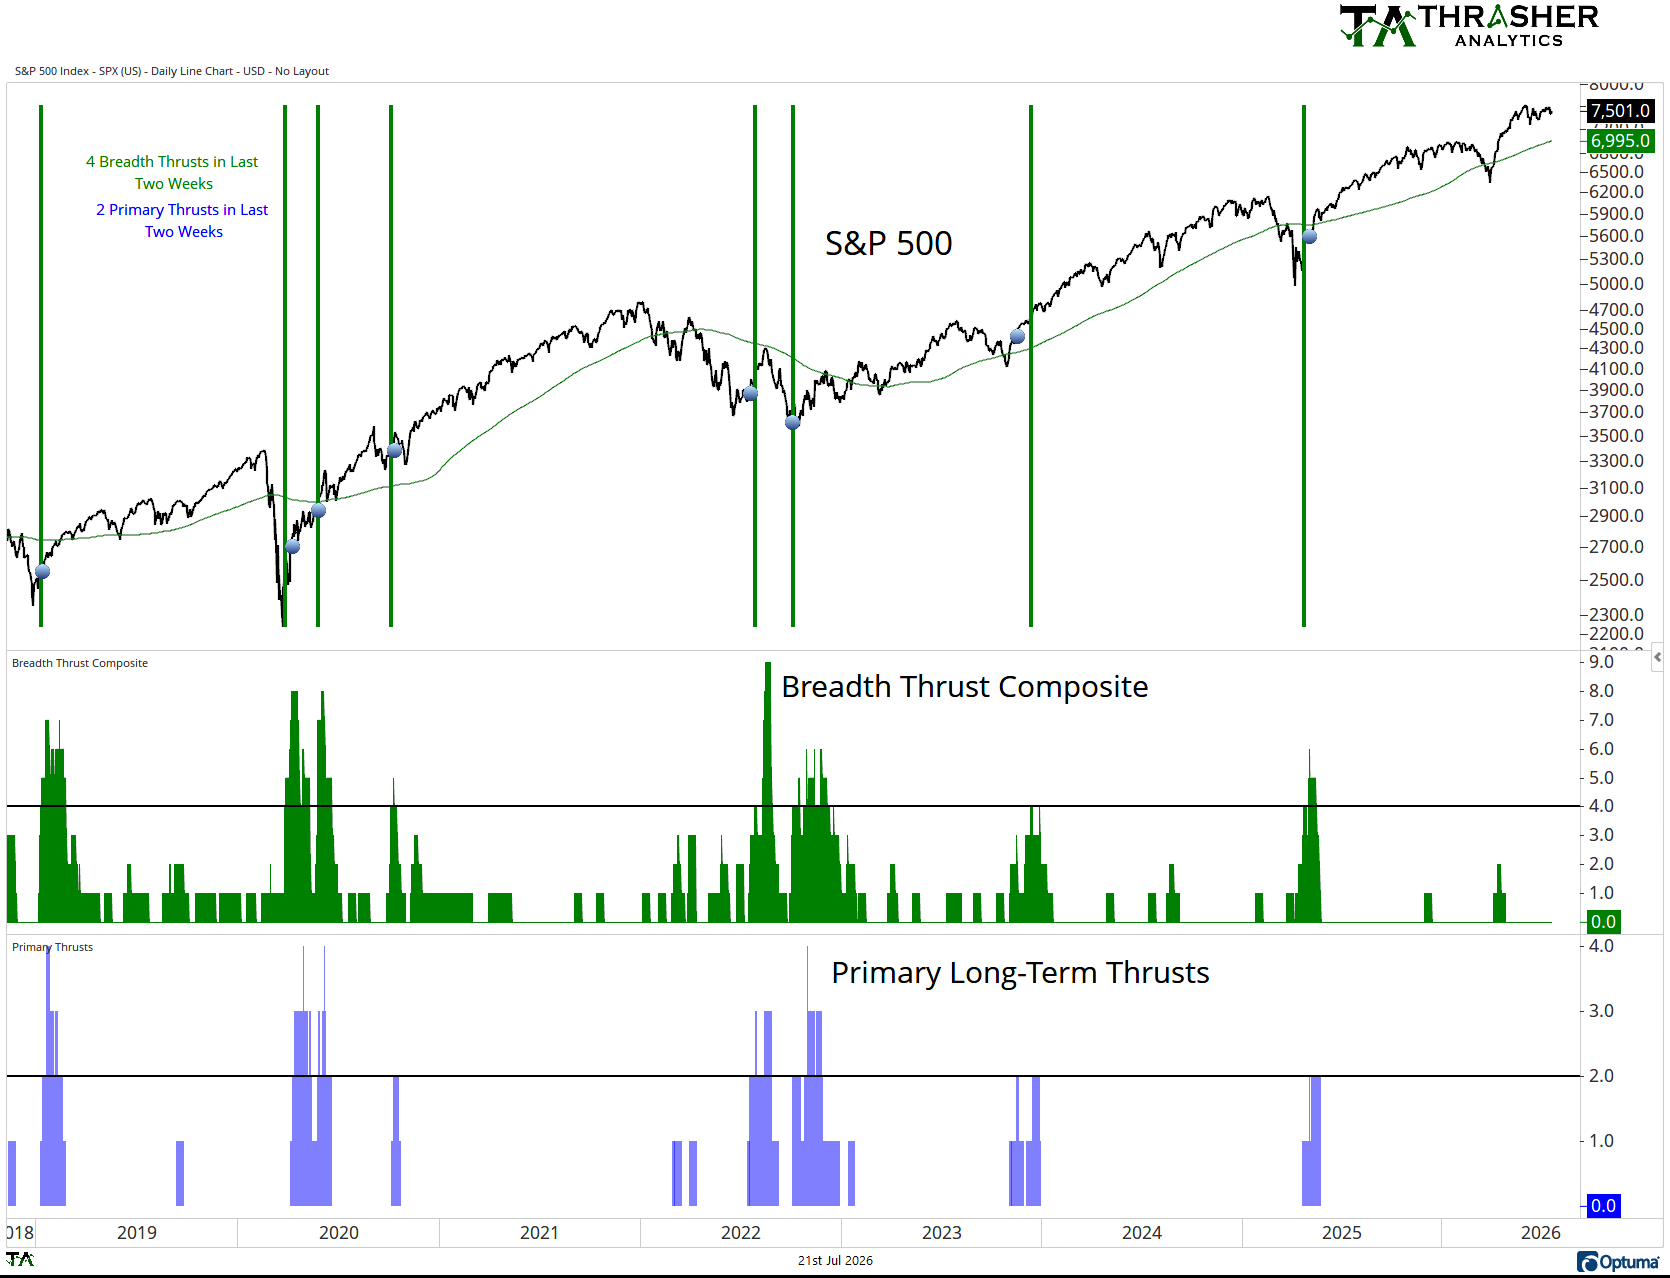
Breadth Thrust Composite
A collection of multiple breadth thrust indicators based on different indices that incorporate price and volume to mark when extremely strong buying activity is taking place by the movement of individual stocks. When multiple of these thrusts occur in a short period of time, the reaction in the S&P 500 has historically been positive going forward.
Breadth Thrust Composite is at 0.
Keep reading with a 7-day free trial
Subscribe to Thrasher Analytics to keep reading this post and get 7 days of free access to the full post archives.