

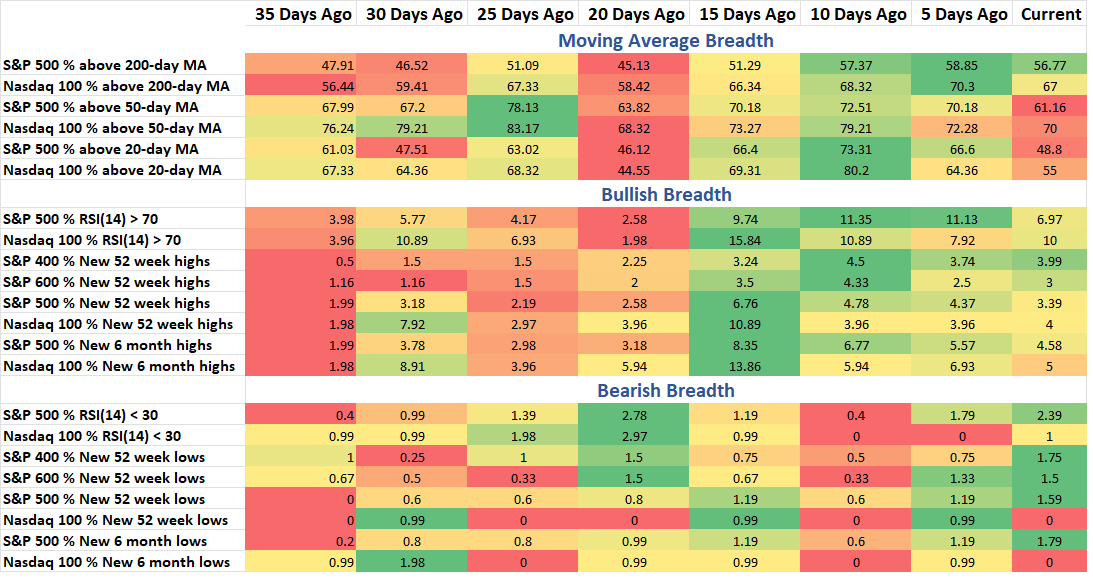
The S&P 500 has remained strong, but some weakness is building up in the breadth data. Note the red showing up on the right side of the table below for some of the Moving Average breadth figures. 3-month highs were at 27% on July 10th and only 6.6% on Monday. Looking again (as I seem to do each week) at the ratio of equal weigh vs. cap weight, the ratio is now at a 20-year low. This week’s breadth note takes a closer look at the moving average data.
Breadth Thrust Composite
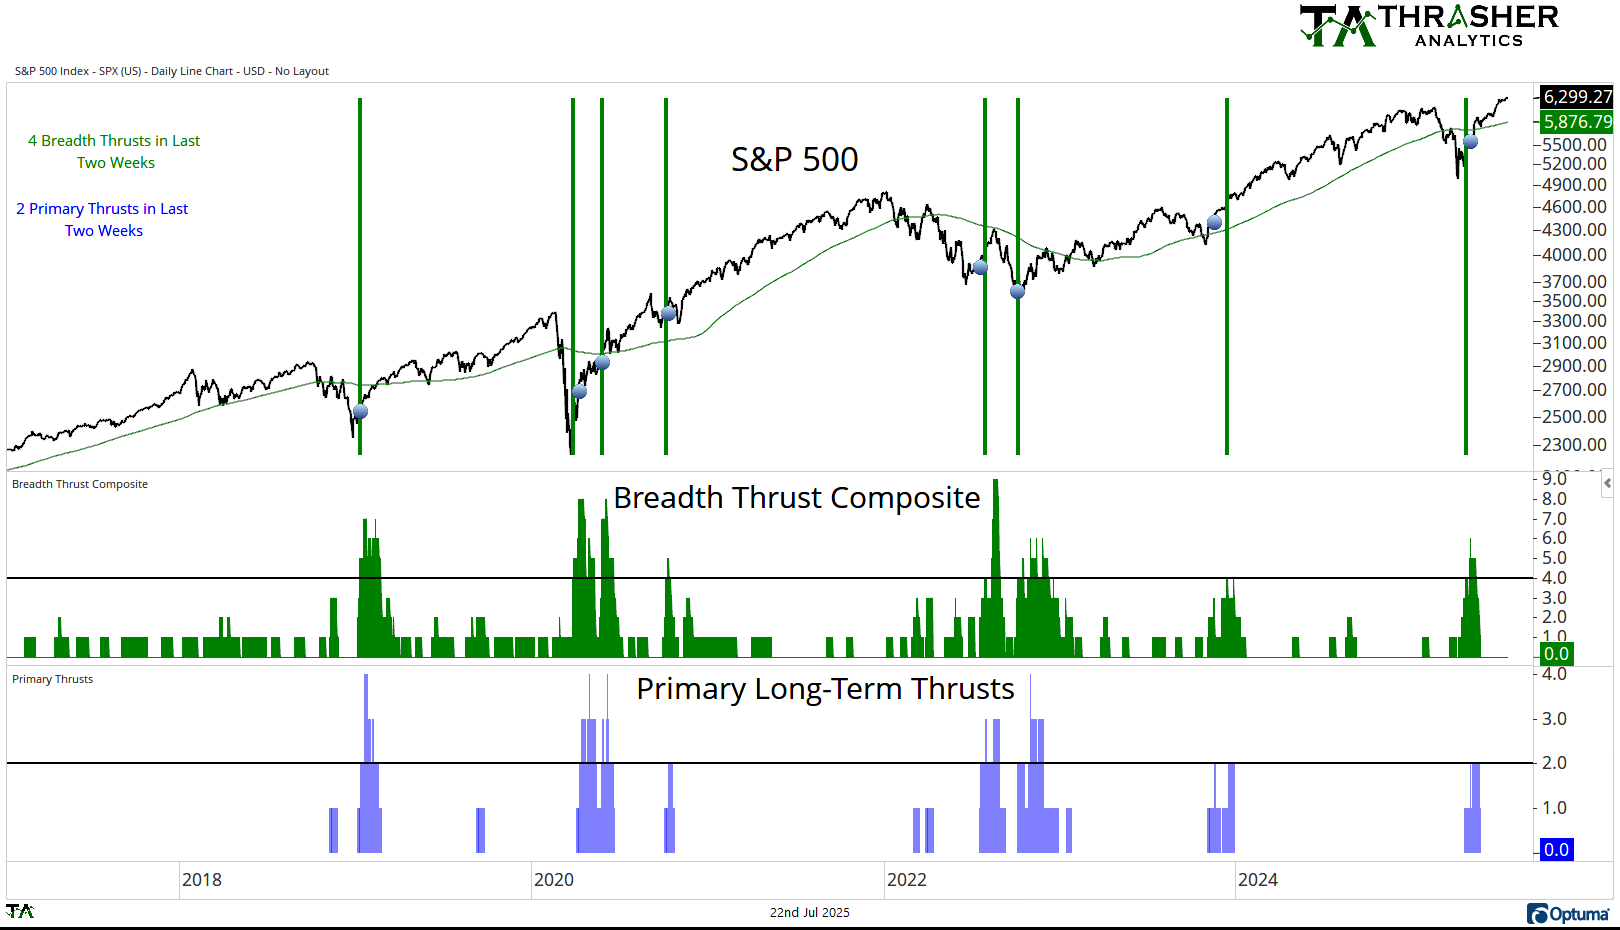
A collection of multiple breadth thrust indicators based on different indices that incorporate price and volume to mark when extremely strong buying activity is taking place by the movement of individual stocks. When multiple of these thrusts occur in a short period of time, the reaction in the S&P 500 has historically been positive going forward.
Breadth Thrust Composite is at 0.
Keep reading with a 7-day free trial
Subscribe to Thrasher Analytics to keep reading this post and get 7 days of free access to the full post archives.