

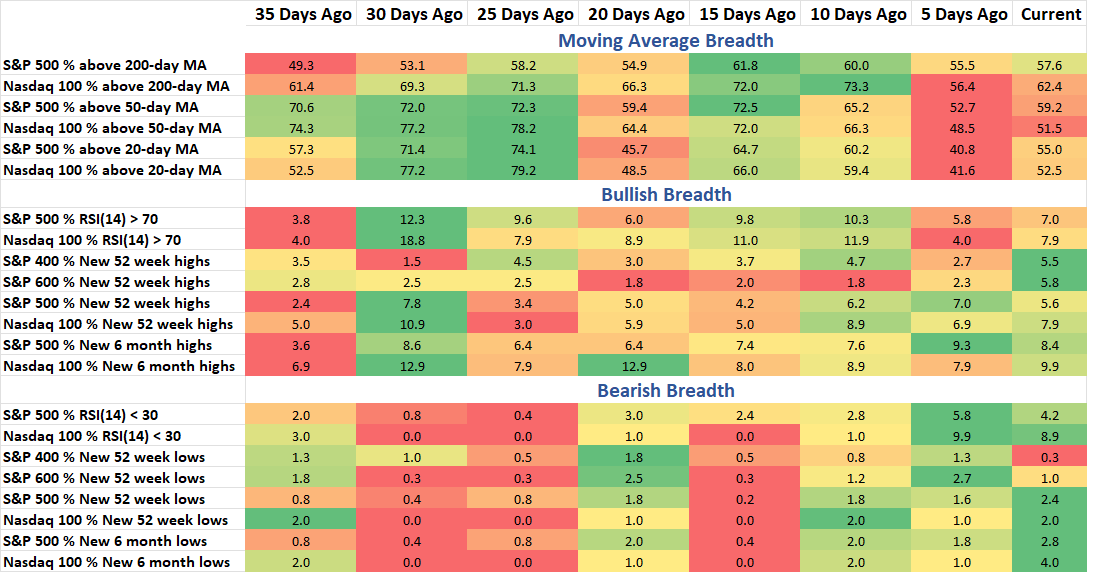
More green in the Bearish Breadth section of the table below than you’d expect considering the S&P 500 made a new all-time high on Monday and Tuesday this week. The price action seems to be getting some fuel from the bullish sentiment around a rate cut in September, which futures market are now pricing in at 95+% odds of happening. Tuesday’s new high was joined by less than 6% large cap stocks.
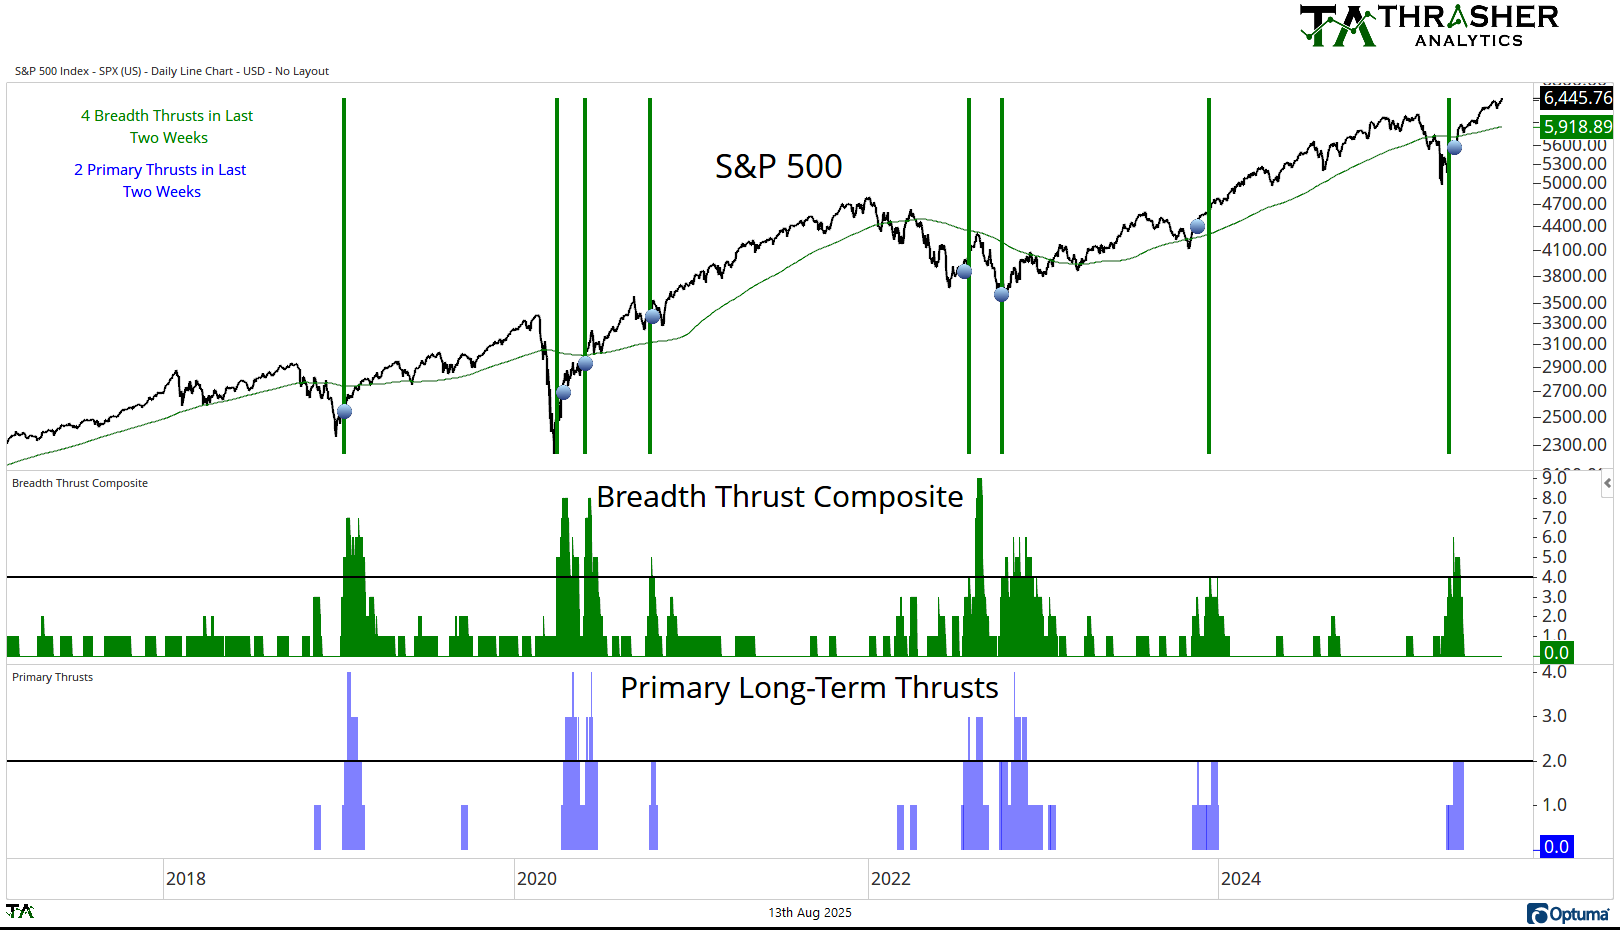
Breadth Thrust Composite
A collection of multiple breadth thrust indicators based on different indices that incorporate price and volume to mark when extremely strong buying activity is taking place by the movement of individual stocks. When multiple of these thrusts occur in a short period of time, the reaction in the S&P 500 has historically been positive going forward.
Breadth Thrust Composite is at 0.
Keep reading with a 7-day free trial
Subscribe to Thrasher Analytics to keep reading this post and get 7 days of free access to the full post archives.