

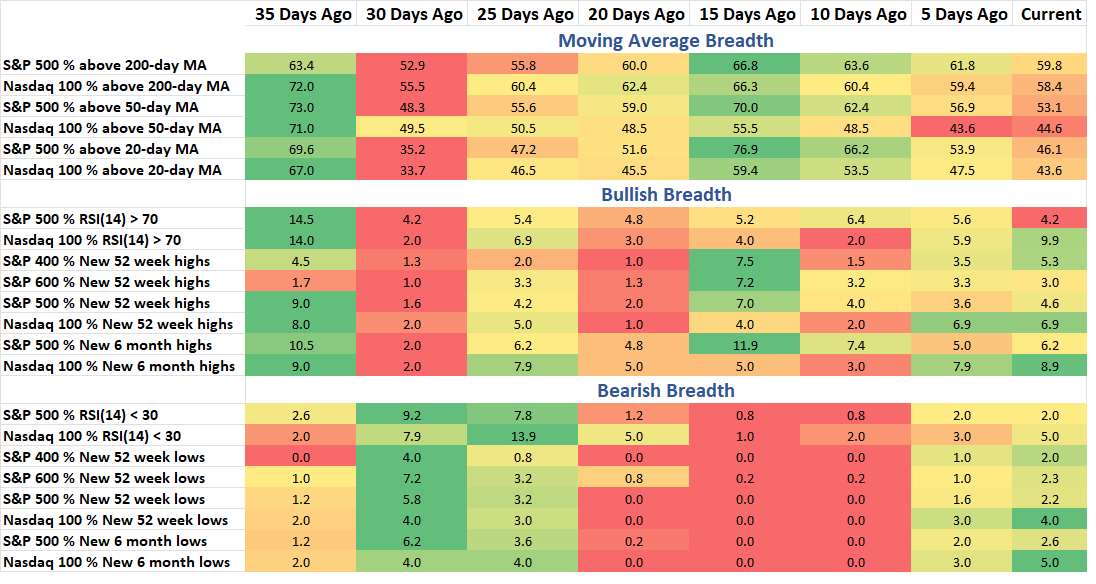
Mix of green across bullish and bearish breadth data, which I think best describes the current environment below hood of the market. Over half of large cap stocks are still down 10% or more from their high and while long-term breadth data still sits near 60%, intermediate and short-term data has fallen with less than half above the 20-day MA and not even 5% made a new high to confirm what the SPX did on Monday with its own new high. This week’s breadth note takes a closer look at some of the new high data for large cap stocks.
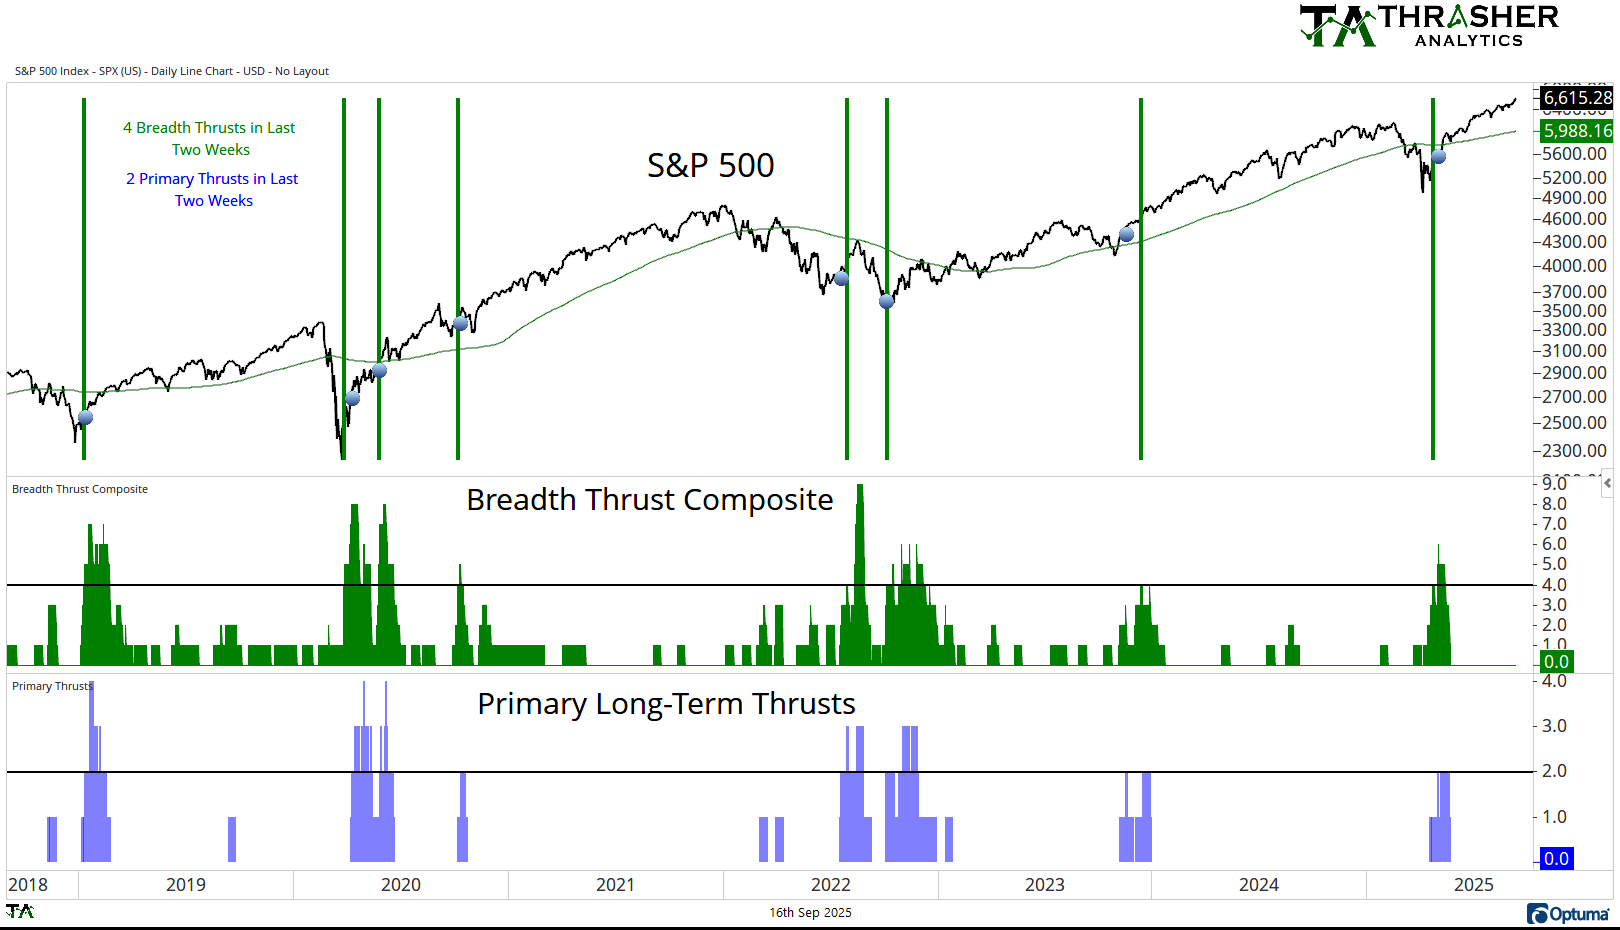
Breadth Thrust Composite
A collection of multiple breadth thrust indicators based on different indices that incorporate price and volume to mark when extremely strong buying activity is taking place by the movement of individual stocks. When multiple of these thrusts occur in a short period of time, the reaction in the S&P 500 has historically been positive going forward.
Breadth Thrust Composite is at 0.
Keep reading with a 7-day free trial
Subscribe to Thrasher Analytics to keep reading this post and get 7 days of free access to the full post archives.