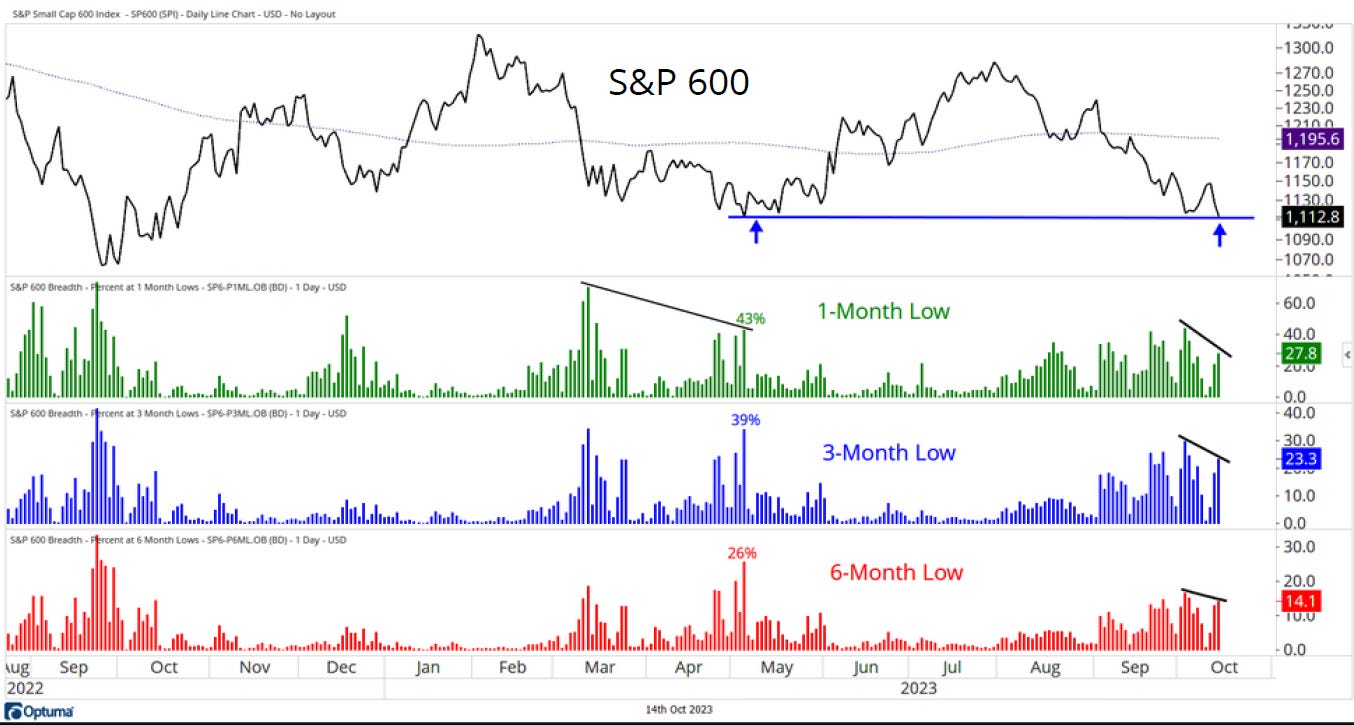
Small Cap Breadth Begins to Improve
Suttle Bullish Divergences Emerge in the Daily S&P 600 Chart
Below is one of the many charts from this week’s Thrasher Analytics letter that was sent to subscribers on Sunday.
Small caps have had a rough year in both absolute and relative. Recently, the S&P 600 has fallen to its May low. However, it’s interesting to note that the new low lists across time frames have been declining. For instance, over 40% of stocks had made a 1-month low earlier this month while just 27% did on Friday. Also compare current breadth to when price was last at this level. 26% of stocks were making a 6-month low in May vs. just 14% right now.
This doesn’t mean we are required to see an immediate reversal in small caps, but it does suggest the internals aren’t as bad as they had been, and this is a good start to the building of evidence for a possible reversal higher if the data continues to improve and price starts confirming.
Want to subscribe to Thrasher Analytics? Use code “substack” to get 15% off any of the three subscription options. Visit www.ThrasherAnalytics.com to learn more.
Disclaimer: Do not construe anything written in this post or this Substack in its entirety as a recommendation, research, or an offer to buy or sell any securities. Everything in this post is meant for educational and entertainment purposes only. I or my affiliates may hold positions in securities mentioned. 15% discount code “substack” applies to first subscription charge for time period selected upon subscribing, renewals will be at original price.


