Spotting An Energy Sector Breadth Thrust
Breadth Thrusts
A breadth thrusts is a way of quantifying strong buying pressure in individual stocks. It’s often measured looking at the percent of stocks that rise above a moving average, how many advance in a certain number of days, or appreciate by a specific percentage. I track quite a few breadth thrusts for the equity market, categorizing them in two composites, as shown to subscribers each week. When we get a large number of these types of bullish price movements, it’s been positive for the market moving higher.
In my last Substack post, I shared several charts sent to Thrasher Analytics subscribers about the bullish setup in oil and the energy sector. You can read that here.
Energy Breadth Thrust
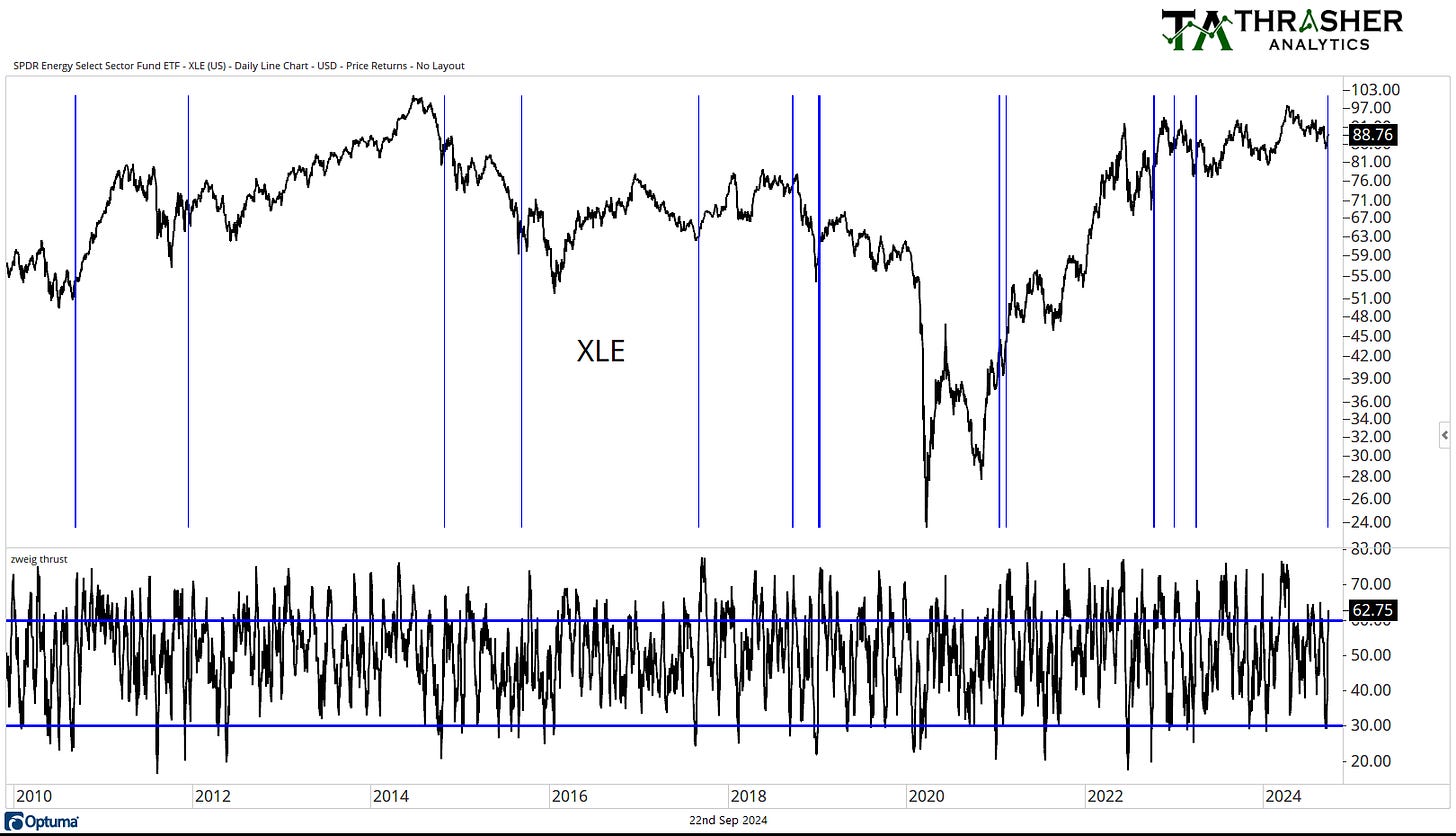
We can also track these types of thrusts for individual sectors, looking for similar types of strong buying pressure of the stocks within the sector. A popular thrust is the Zweig Breadth Thrust which looks at a smoothed daily advance-decline line of stocks going from an extremely low level to a high level in a short period of time. This suggests that stocks are going from strong downward pressure to strong upward pressure by traders. I apply a version of the Zweig Thrust to the energy sector in the chart below, marking blue lines each time its occurred.
Many of the instances result in continued upside by XLE, with a few failures (the covid crash being the most notable ‘interruption’ of the thrust).
Disclaimer: Do not construe anything written in this post or this Substack in its entirety as a recommendation, research, or an offer to buy or sell any securities. Everything in this post is meant for educational and entertainment purposes only. I or my affiliates may hold positions in securities mentioned.


