

Switchback Stock Scan
Introducing Switchback, a systematic scan finding turning points in individual stocks
Markets rarely move in straight lines. The most powerful opportunities often emerge when trends stretch too far, weaken internally, and begin to lose structural integrity—long before price visibly reverses. Switchback is built to identify those moments and will be published to paid subscribers every week.
Switchback produces systematic stock scan results generated from weekly price data, focusing on stocks experiencing steep drawdowns. History shows that large declines frequently create the conditions for strong short- and intermediate-term gains. But not all drawdowns are equal. Switchback is designed to distinguish between declines that can persist and those that are becoming unstable.
Rather than relying only on simplistic oversold indicators, Switchback evaluates when a downtrend is no longer able to sustain itself. The system gauges the quality of the trend. When selling pressure begins to exhaust, internal momentum behavior often changes before price does. That shift is where Switchback operates.
At the core of Switchback is a composite framework built from multiple measures of trend stability, momentum exhaustion and divergences. Momentum is evaluated across various lookback periods, allowing the system to detect situations where downside price movement continues while underlying momentum begins to stabilize, flatten, or rise in a bullish manner.
No single indicator drives a signal. Each scan result emerges only when multiple independent metrics align, increasing the probability that a drawdown is transitioning from continuation to inflection.
Switchback does not provide trade recommendations. No buy or sell instructions are given. The signals published are ideas, not directives—designed to highlight stocks entering statistically and structurally interesting zones where reversals could occur. How, when, or whether to act on those ideas is left entirely to the subscriber. No investment advice is being given. Seeking confirmation of a trend change can be an important next step. For example, a single week or multi-week close higher.
Switchback is built for traders and investors who value process over prediction, structure over emotion, and signals grounded in repeatable market behavior. It is not just about calling bottoms. It is about recognizing when a path that has been moving downhill begins to curve—quietly or aggressively —toward a potential turn.
In markets, the most meaningful moves often begin where trends can no longer hold.
That is where Switchback focuses.
Let’s Dive into Some Examples…
Let me begin with, I didn’t cherry-pick the best charts. I actually will show some examples of where scan results didn’t “work” and charts that were in deep drawdowns and yet still didn’t generate signals.
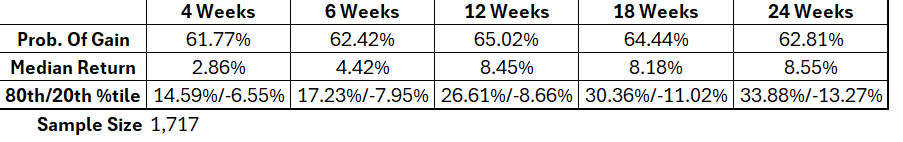
First, here’s a look at some of the testing data for Switchback. This looks at scan results from the last ten years of stocks that were in the S&P 500. Over the last decade there were 1,717 results. What stands out as significant to me is the 80/20 percentile data. Six weeks later the 80th percentile result is over 2x greater than the loss experienced at the 20th percentile of the full sample, and this grew to 3x at the 12-week mark.
Here are some of the charts pulled from the sample with a few comments on some of them. But the primary purpose of sharing the examples is to show that the scan results aren’t meant to find every low in every stock but to quantitively identify periods in a stocks drawdown where the odds of a reversal are above average.
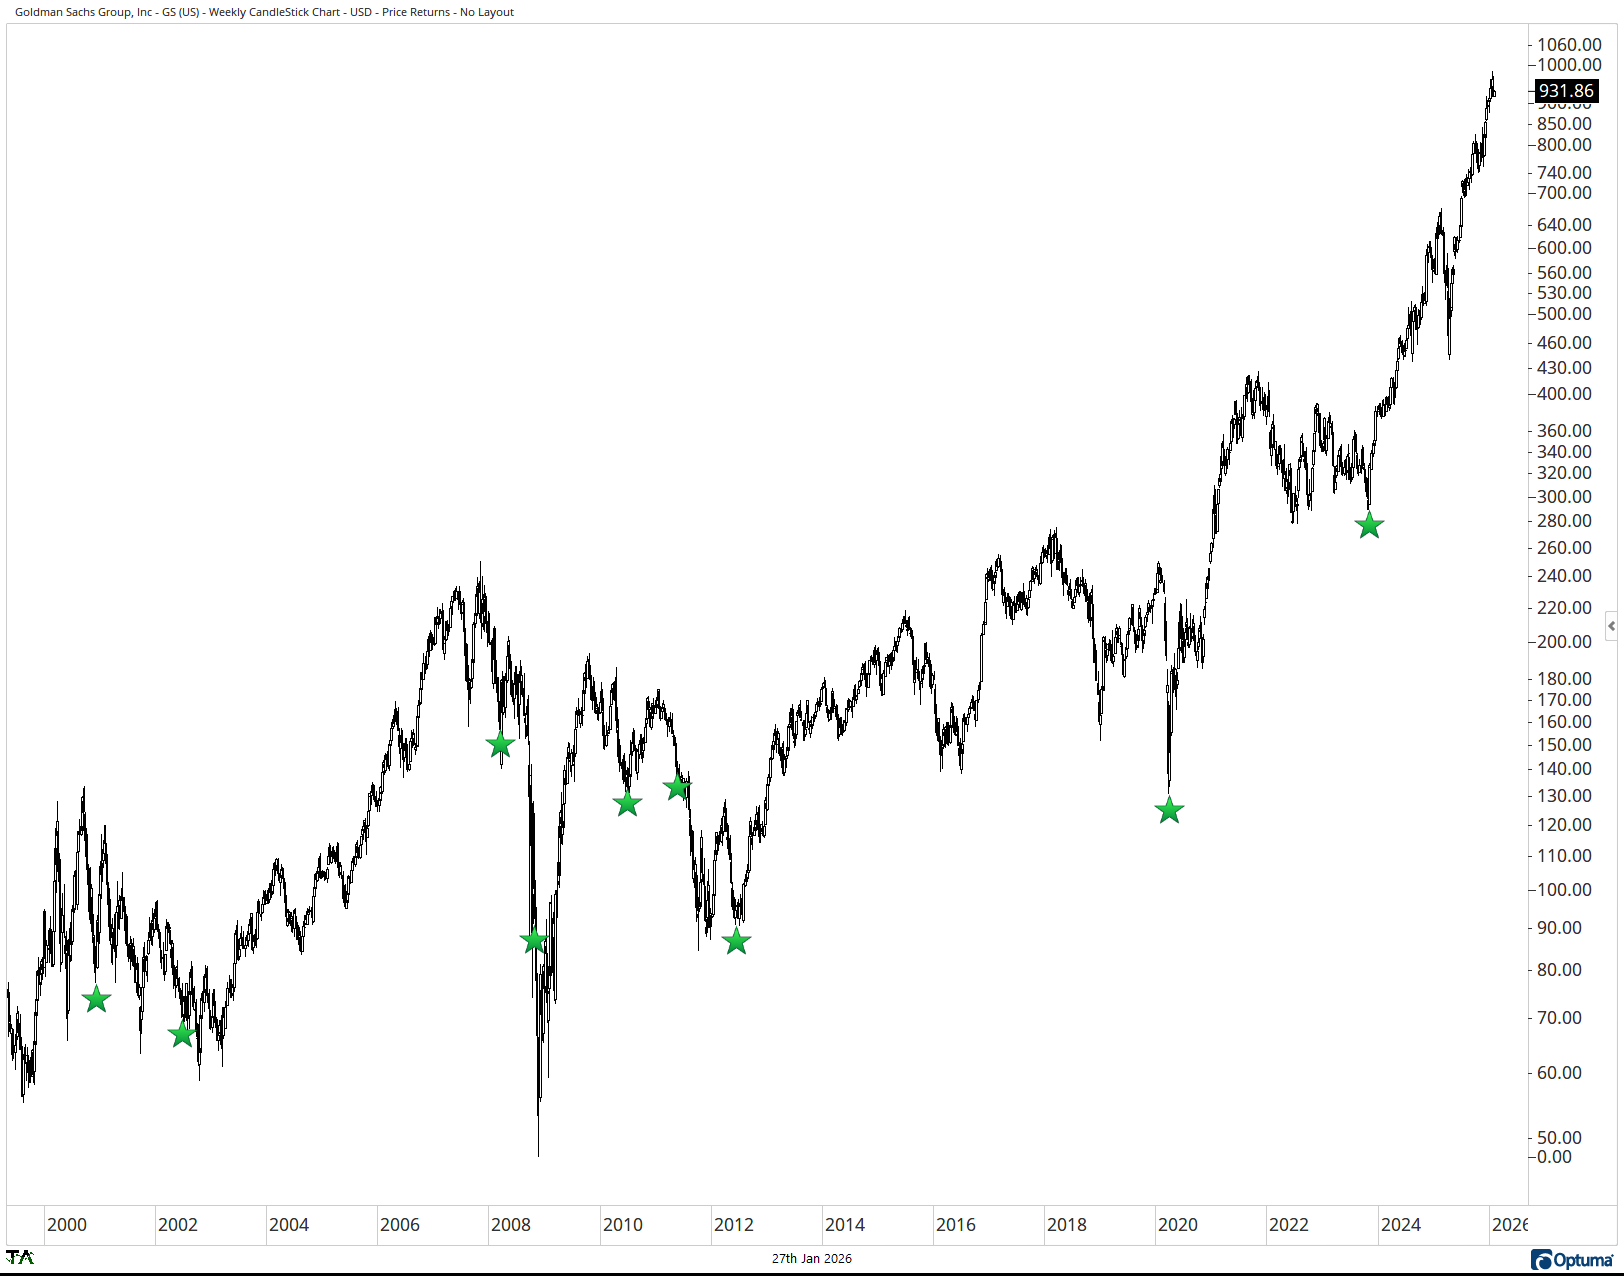
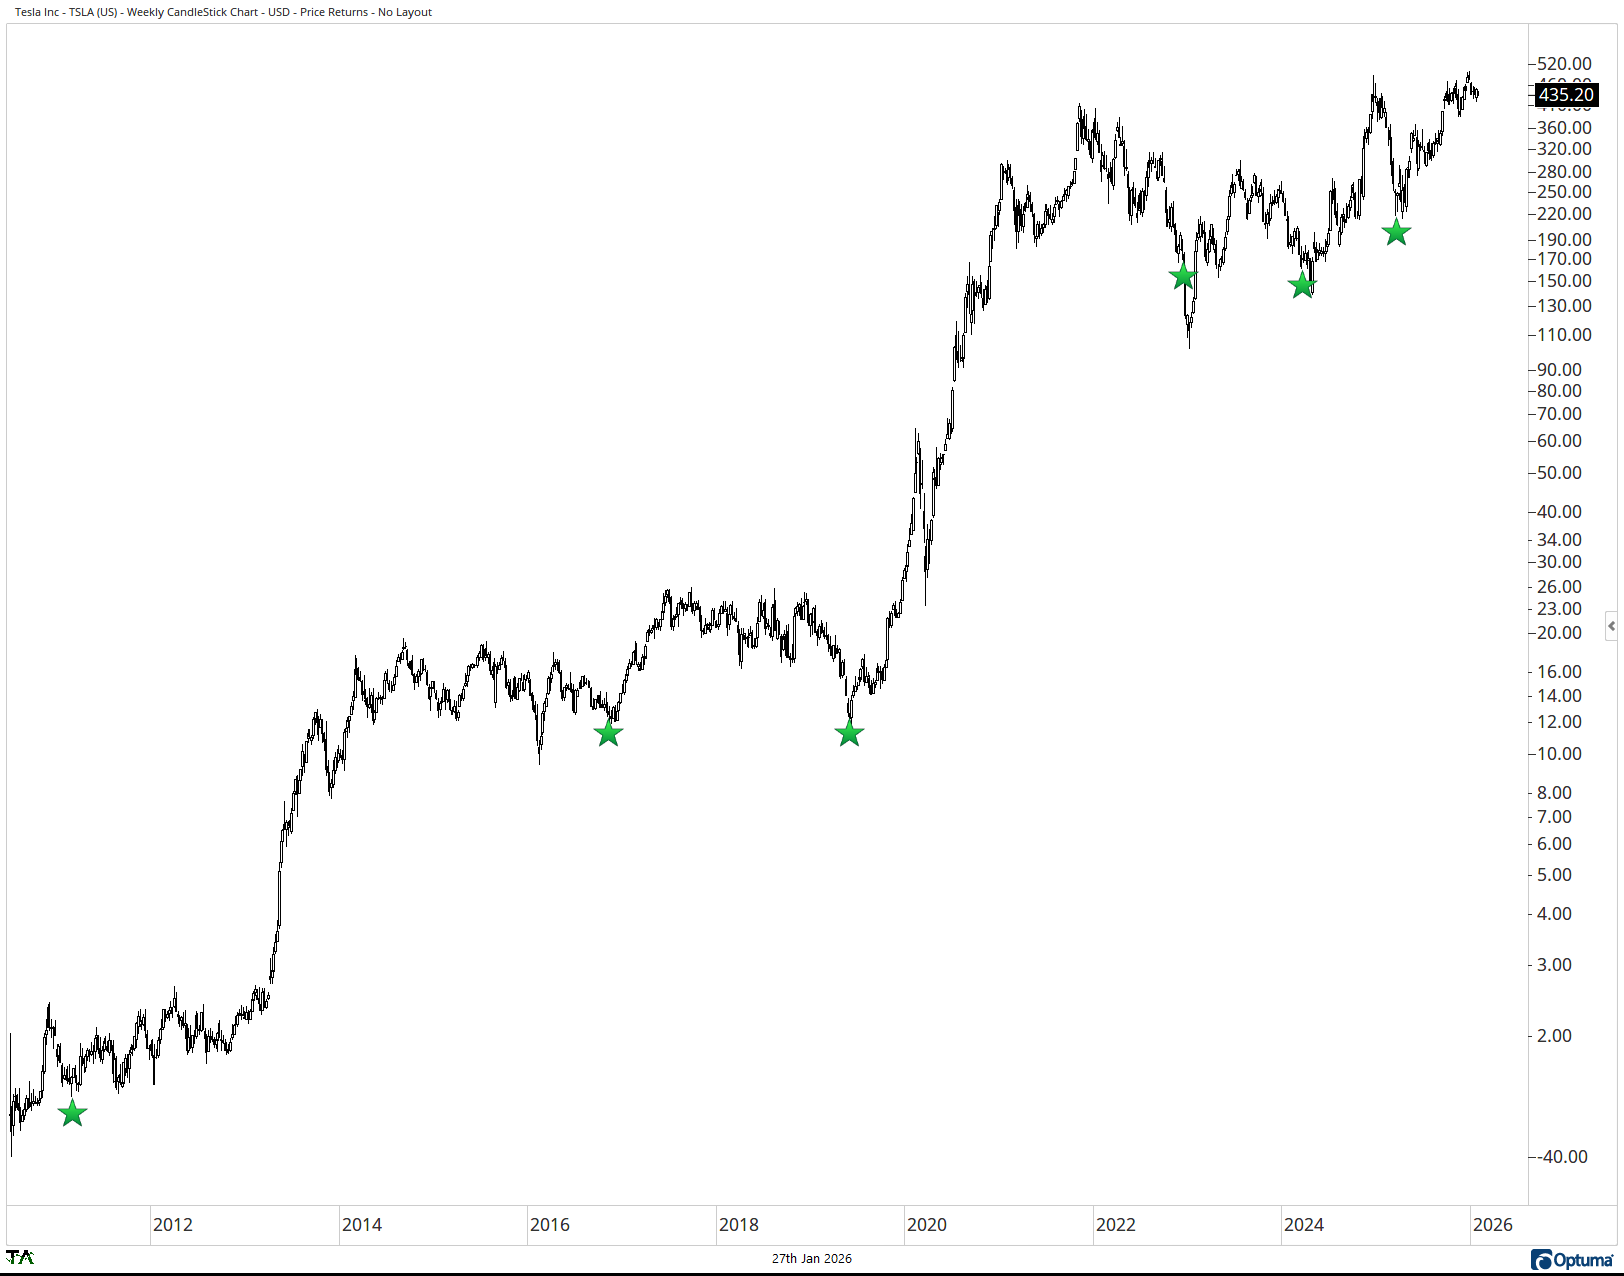
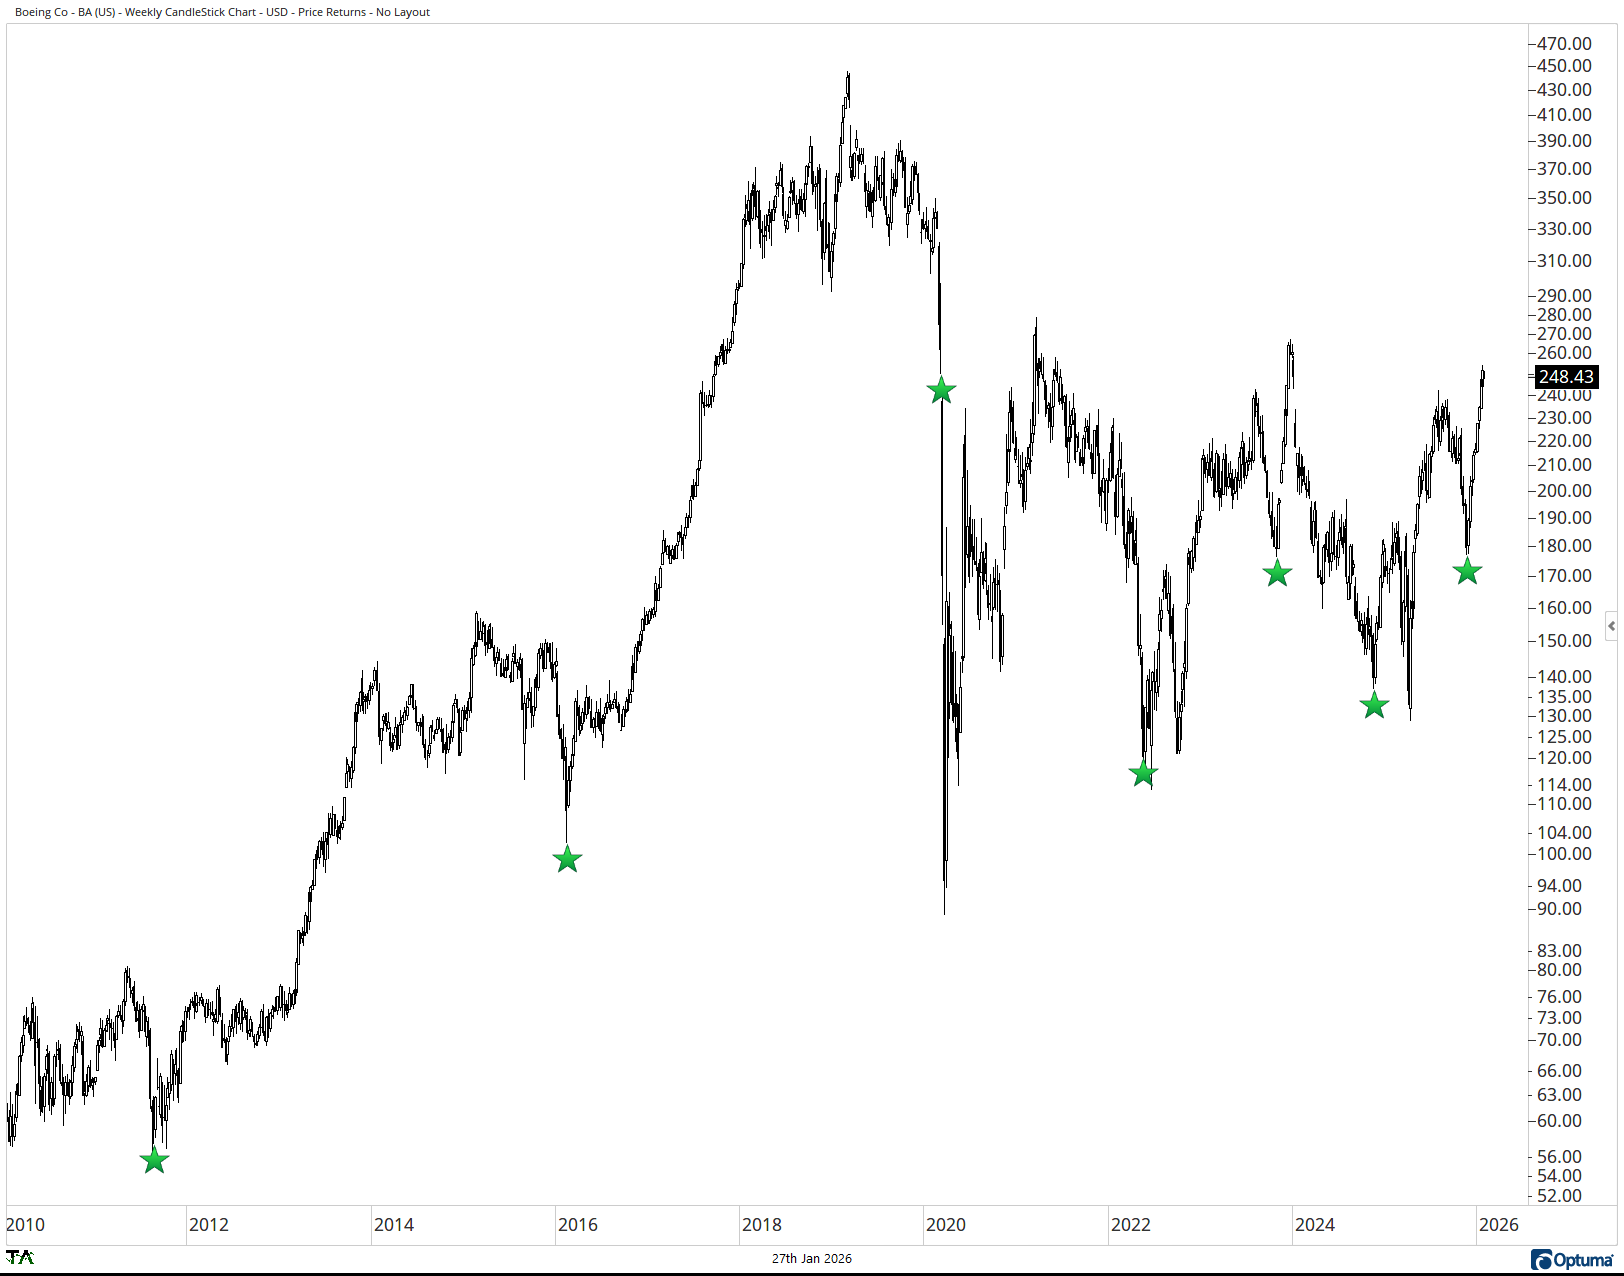
Volatile stocks like TSLA, BA, and GS can be hard for mean reversion traders to identify turning points. Switchback’s scan criteria have shown to identify several of the key periods in stocks like these before showing sharp reversals.
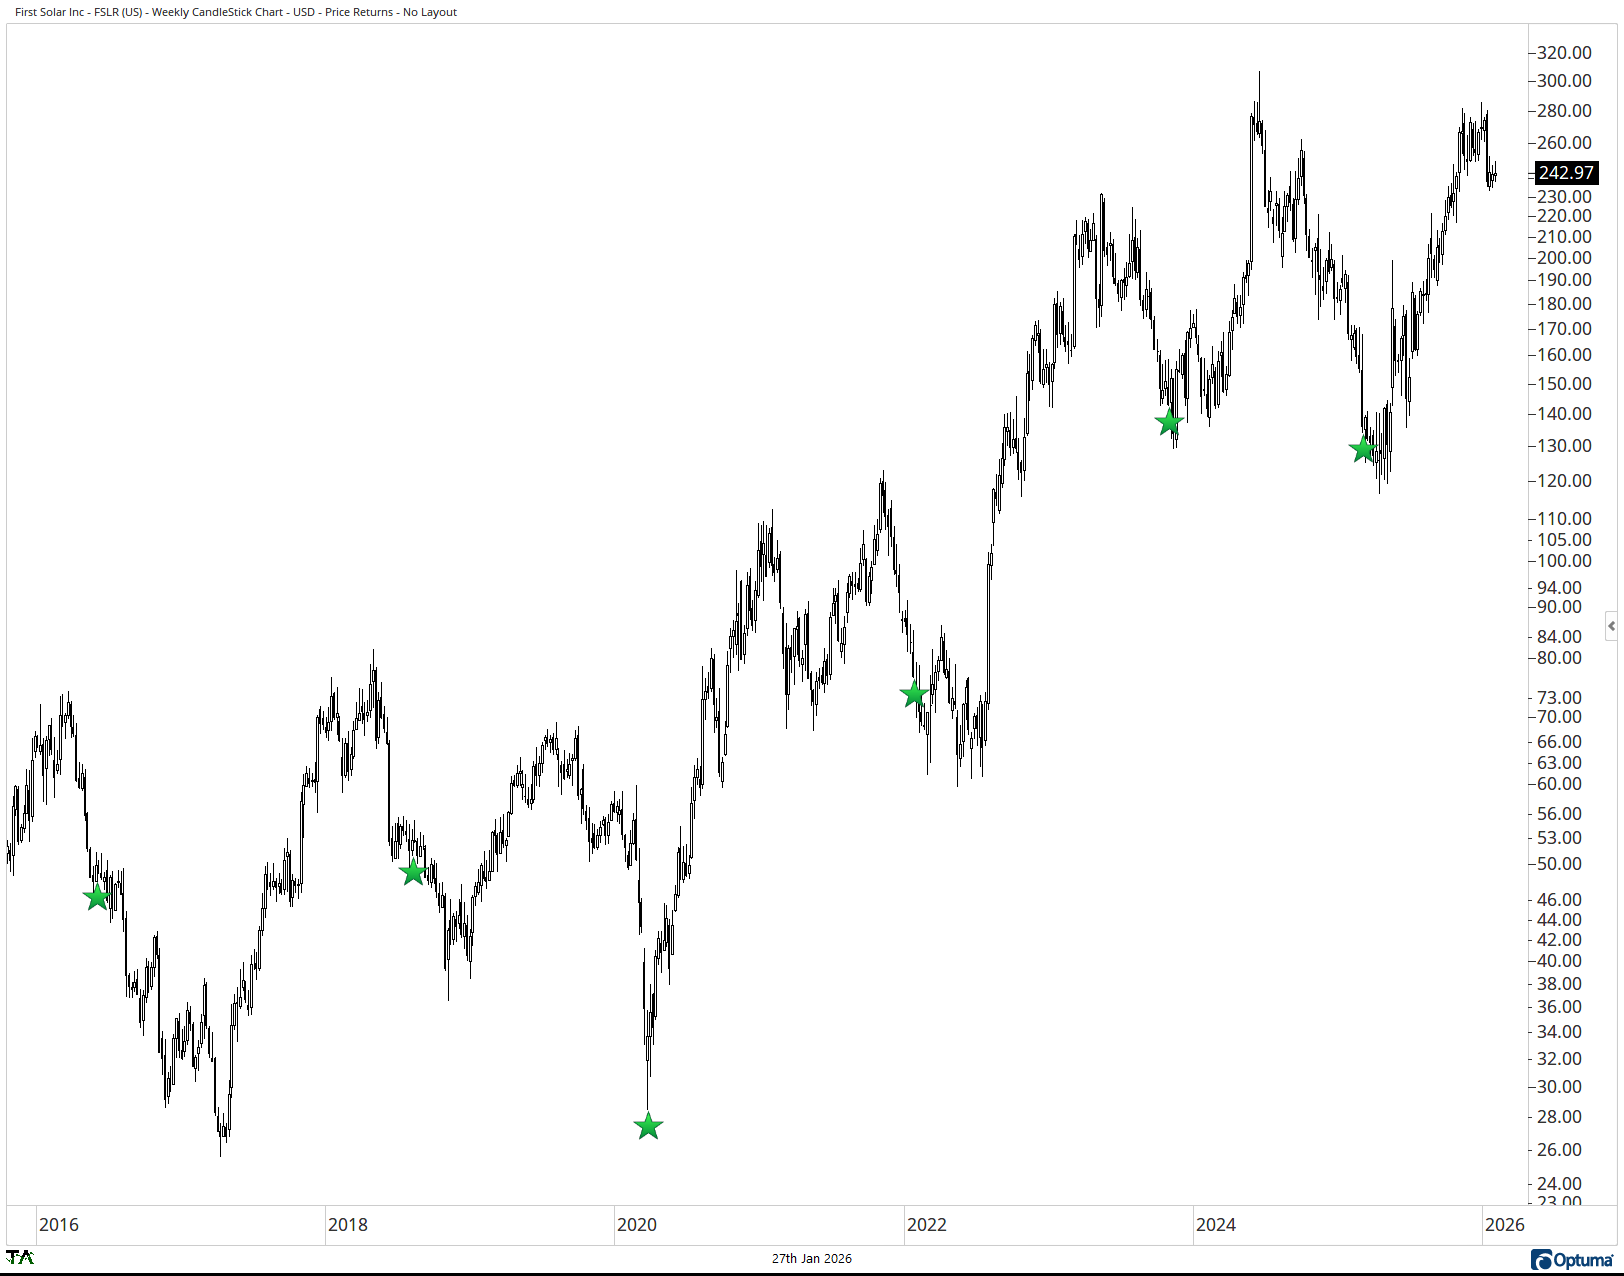
First Solar is a good example where lack of confirmation proves useful. Both 2016 and 2018 signals didn’t see the stock move above the signal week’s close or open and the stock slid further. 2022 saw a -13% continued move lower before rising 260%. 2024 signal was followed by price rising 90% and 2025 signal resulted in a 100% appreciation in price.
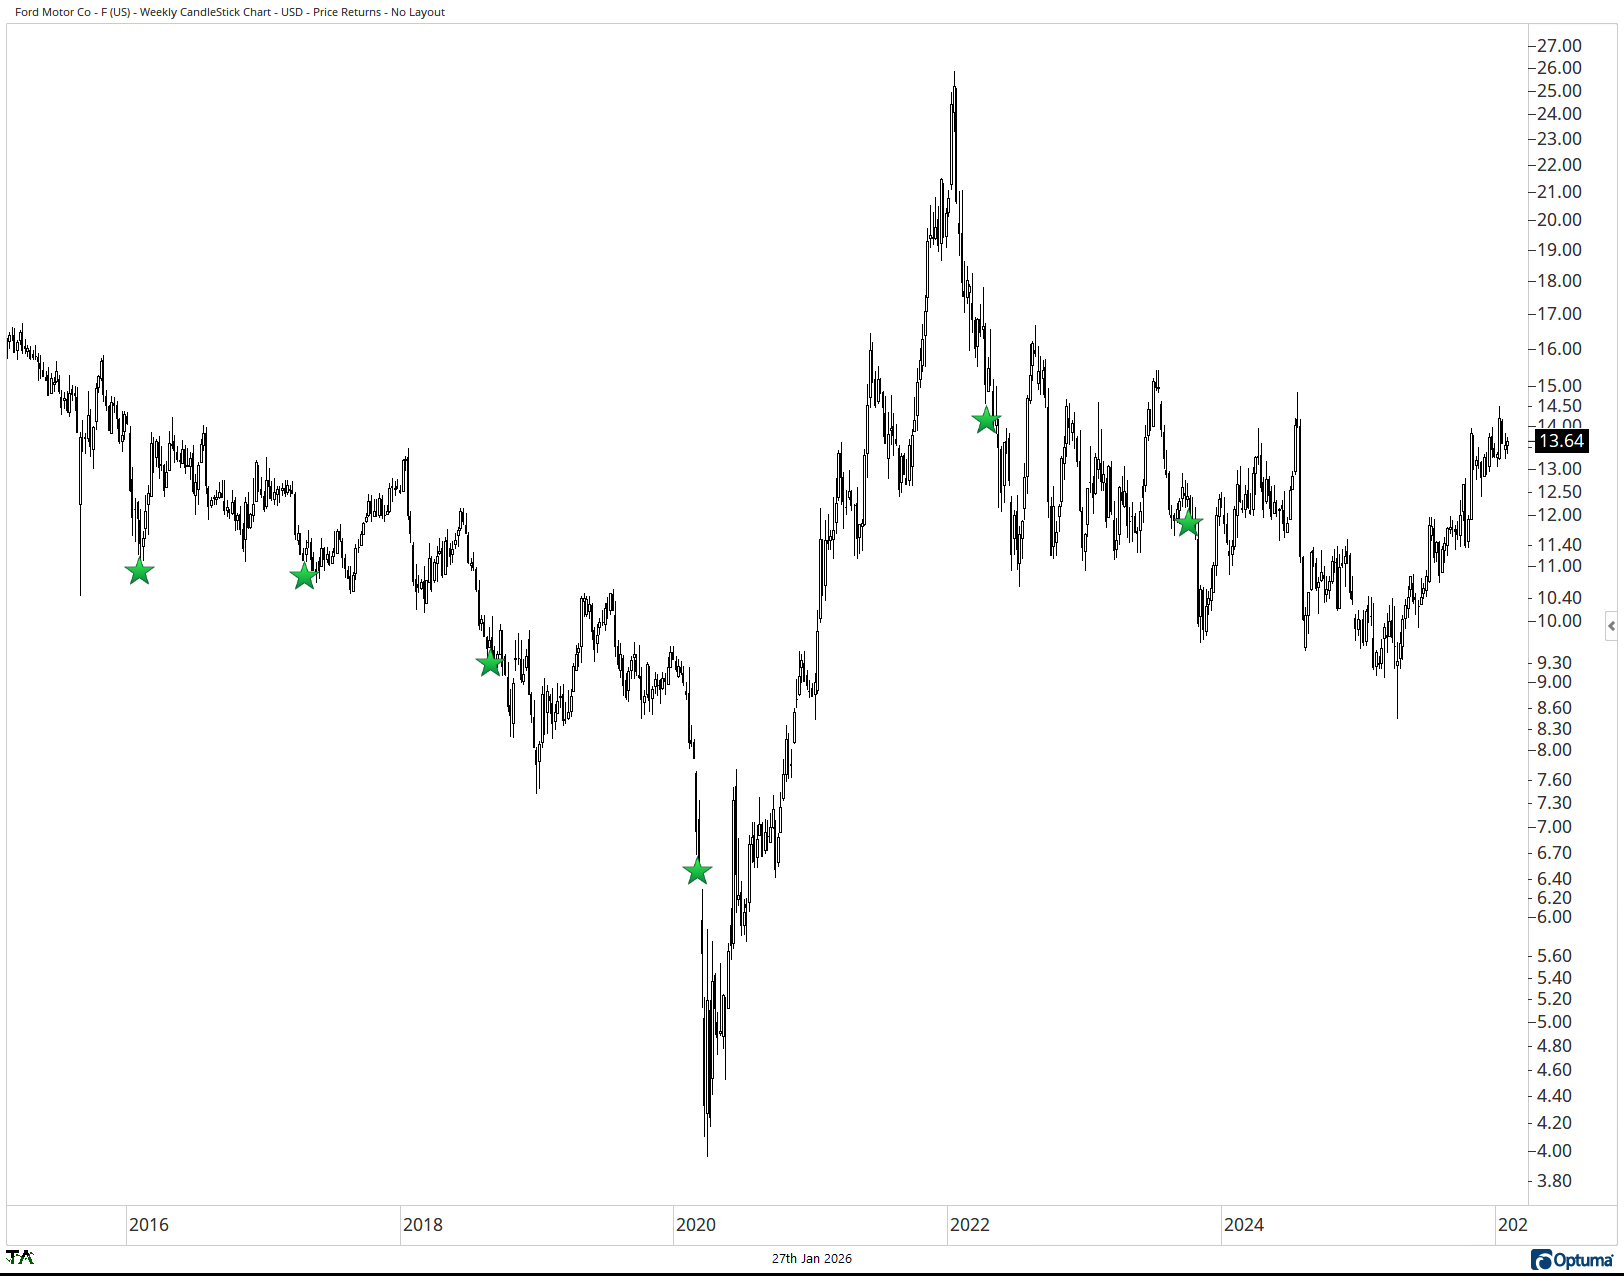
Ford has had several nasty multi-year drawdowns. It hit he scan in 2017, showing signs of confirmation by moving higher before dipping 7% over seven weeks before rising 25%. Again in 2018 it met the scan criteria but still fell -18% during the mini-bear market at the end of 2018. 2022 nor 2023 signals got confirmation and the stock slid lower.
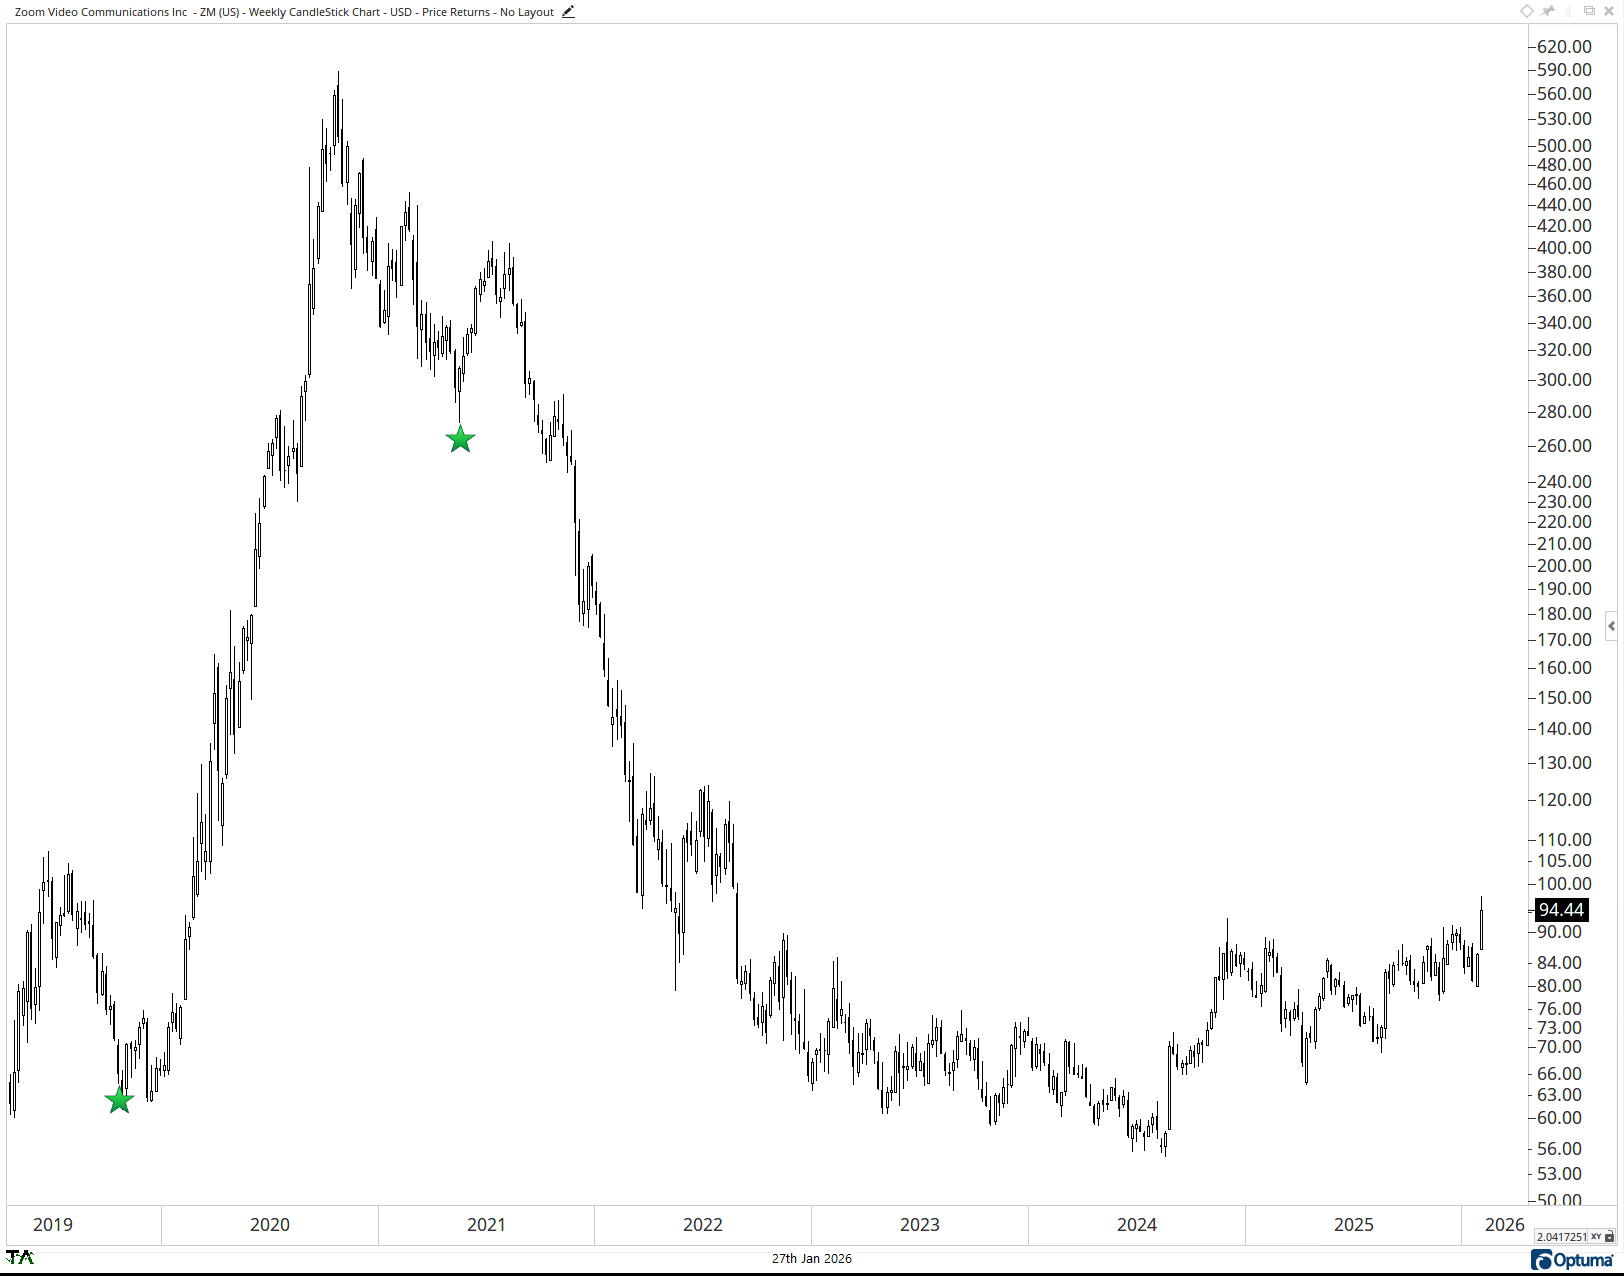
Just because a stock is in a large drawdown doesn’t mean it’ll land on the scan results. Zoom is a great example. It met the criteria of the scan just twice. In 2019, just before the stock exploded as a result of the Covid Crash and then saw a 30% jump in 2021. After that, the stock rolled over and despite the large decline, never met the Switchback criteria again, despite the several false countertrends in its descent.
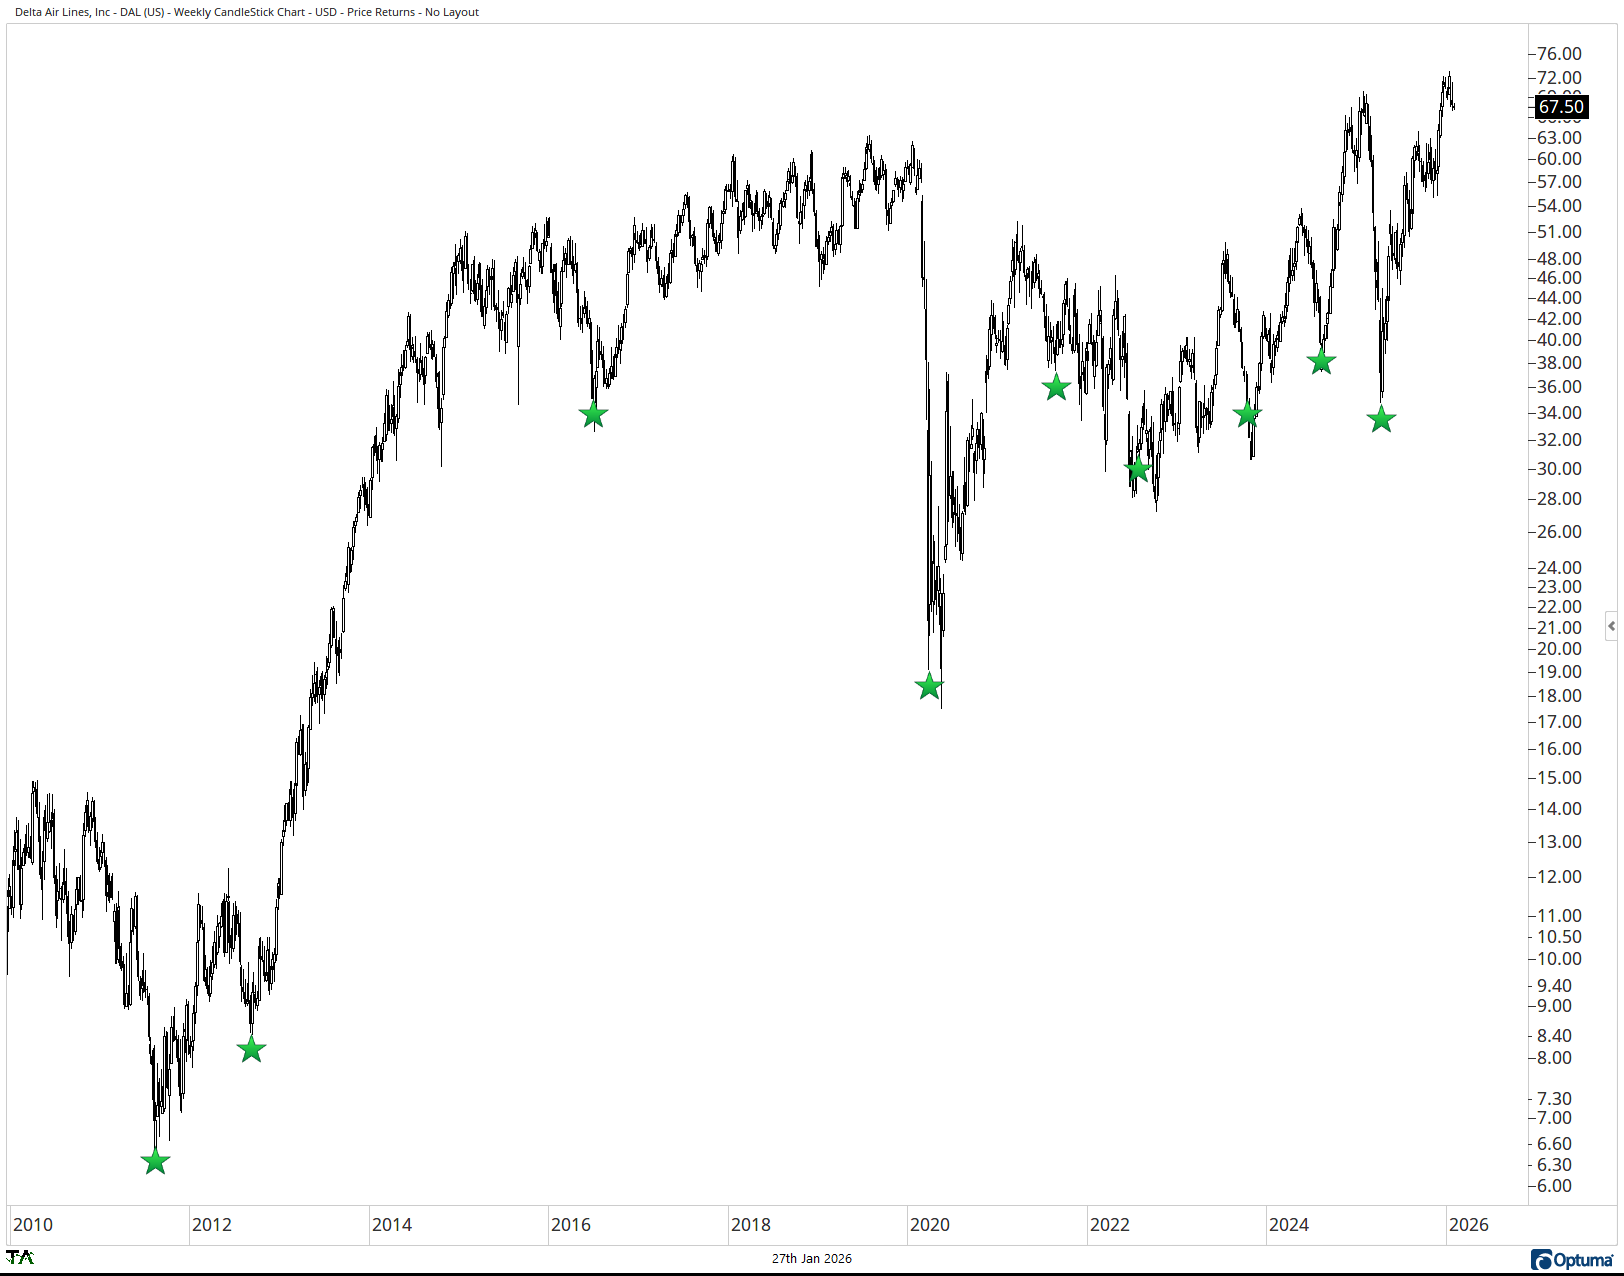
Delta’s attempt at an uptrend since it’s 2020 low has been rocky. It’s included several sharp pullbacks and a couple 70+% advances. A trader attempting to navigate price action on a dictionary basis would have a tough time in a stock like DAL over the last five years. Switchback would have been an excellent tool in beginning to uncover periods where DAL was posed to take off.
No reproduction, transmission, or distribution permitted without consent of Thrasher Analytics LLC ("Thrasher Analytics"). The material contained herein is the sole opinion of Thrasher Analytics. This research has been prepared using information sourced believed to be reliable. Such information has not been independently verified and no guarantee, representation or warranty, express or implied, is made as to its accuracy completeness or correctness. It is intended for the sole use by the receipt to whom it has been delivered to by Thrasher Analytics. The delivery of this report to any person shall not be deemed a recommendation by Thrasher Analytics to affect any transaction in any securities discussed herein. For more information, please refer to the Disclaimer/Terms & Service page of our website.