[Sent to premium subscribers on Sunday night…]
Spotlight Chart: Declining Volume
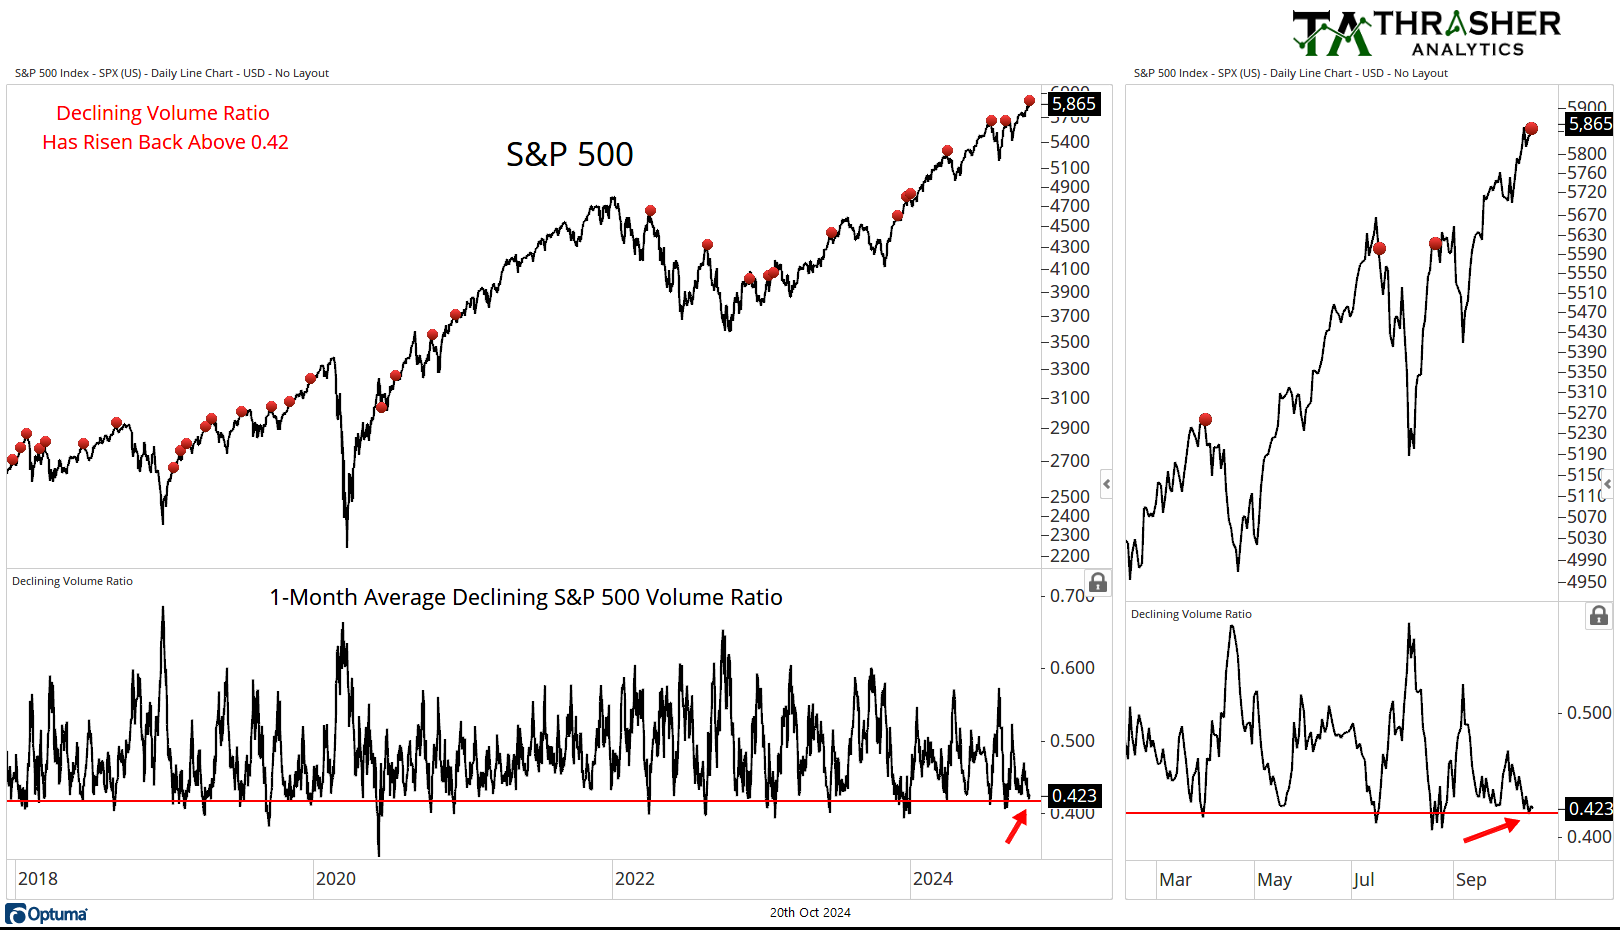
Each week, I’ll select one chart that’s very timely to the current market to spotlight in the Sunday post. This week, that chart is the ratio of declining volume. This shows what percentage of volume is traded on declining stocks. When it becomes extremely low, it tells us that buying and selling pressure may have become unbalanced in the short-term. This has marked the prior three minor pullbacks ranging from -5.5% in April, -8.5% in the summer, and -4% in September.
No reproduction, transmission, or distribution permitted without consent of Thrasher Analytics LLC ("Thrasher Analytics"). The material contained herein is the sole opinion of Thrasher Analytics. This research has been prepared using information sourced believed to be reliable. Such information has not been independently verified and no guarantee, representation or warranty, express or implied, is made as to its accuracy completeness or correctness. It is intended for the sole use by the receipt to whom it has been delivered to by Thrasher Analytics. The delivery of this report to any person shall not be deemed a recommendation by Thrasher Analytics to affect any transaction in any securities discussed herein. For more information, please refer to the Disclaimer/Terms & Service page of our website.