

Updated Models & Spotlight Chart 1/26/2025
Watching a Key Level in One Breadth Metric as Few Stocks Confirm the New High
Stocked continued to advance, hitting a new all-time high with a 1.74% gain on the week, led by XLC, XLV, and XLI. God also hit a new 52-week high, something I’ve been writing about recently as the metal had been showing strength in other major currencies and now has confirmed in U.S. dollars as well. With the new high in the index, few stocks showed signs of confirming. For just the third time in 20 years less than 60% of stocks were above their 200-day moving average. The two prior instances were the 2007 peak and in 2020 before the quick -10% pullback during the recovery from the Covid Crash. While we have few stocks confirming the high, there also aren’t many making new lows either, so the market is at an inflection point, whether we see some breadth expansion or a breakdown that shows up in the new low list data.
This week’s Spotlight Chart looks at one area of breadth that doesn’t get discussed very often and the key level I’m watching in this data set for potential signs of bearishness.
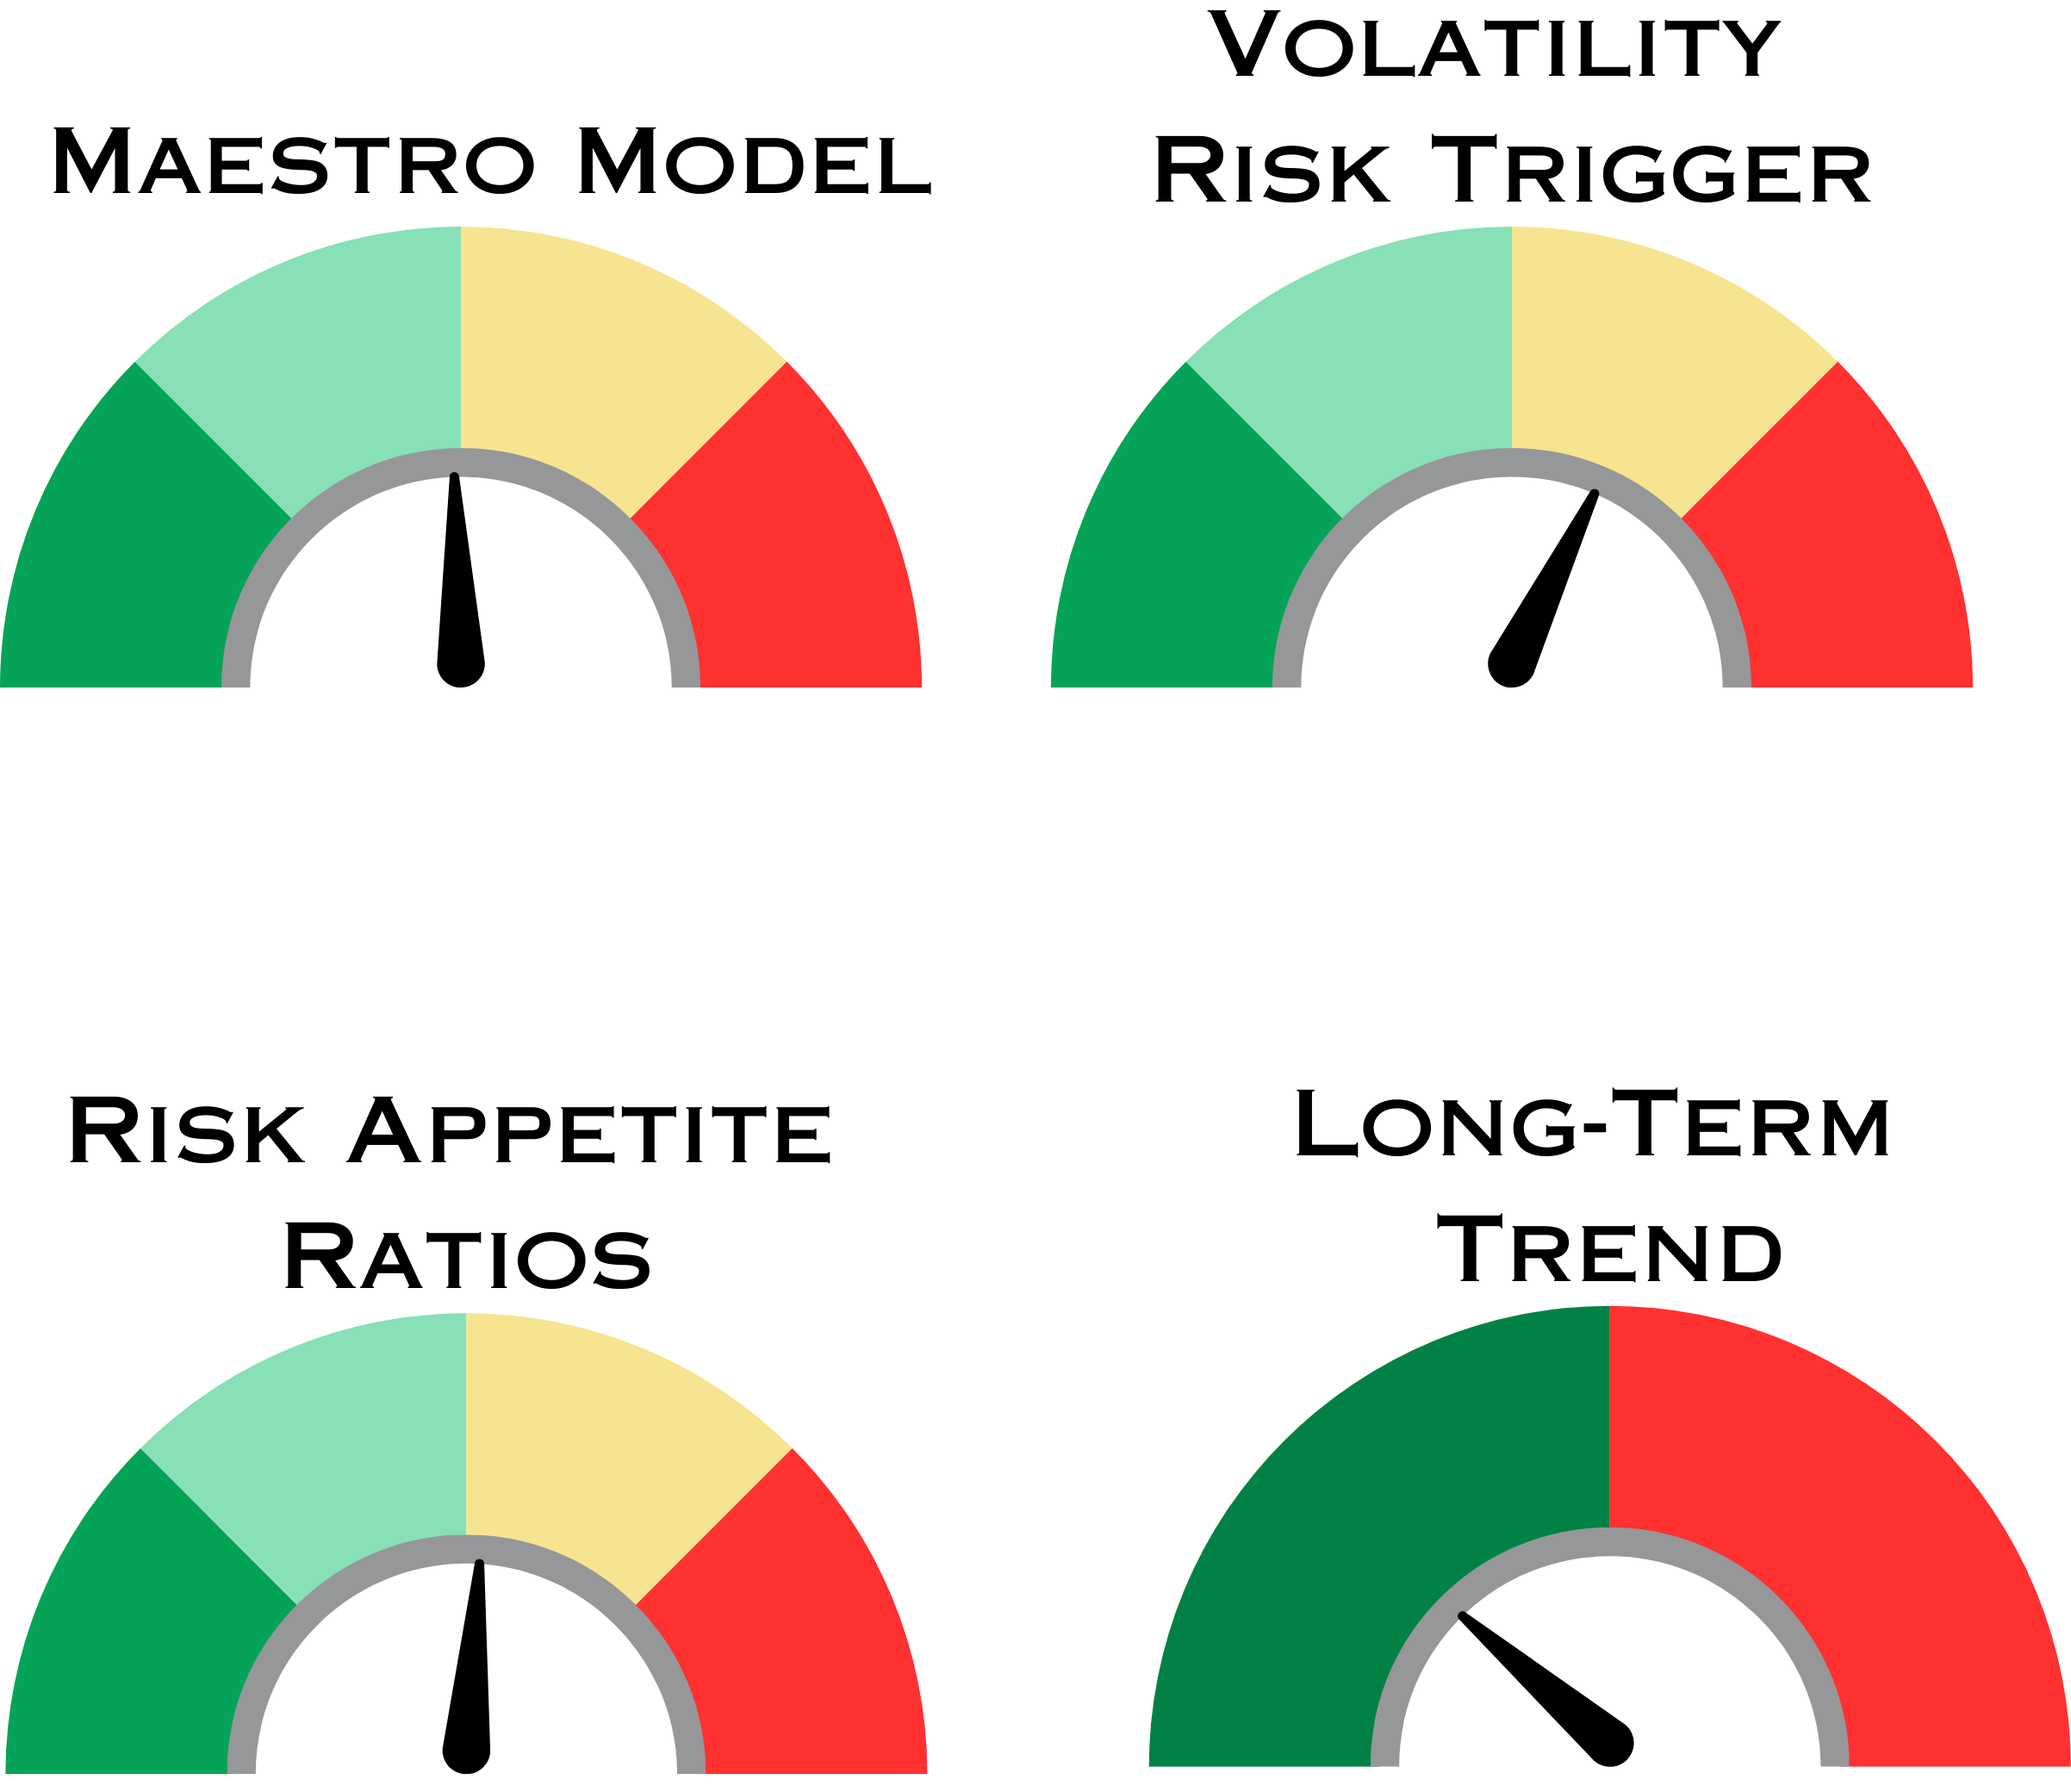
Summary of Models
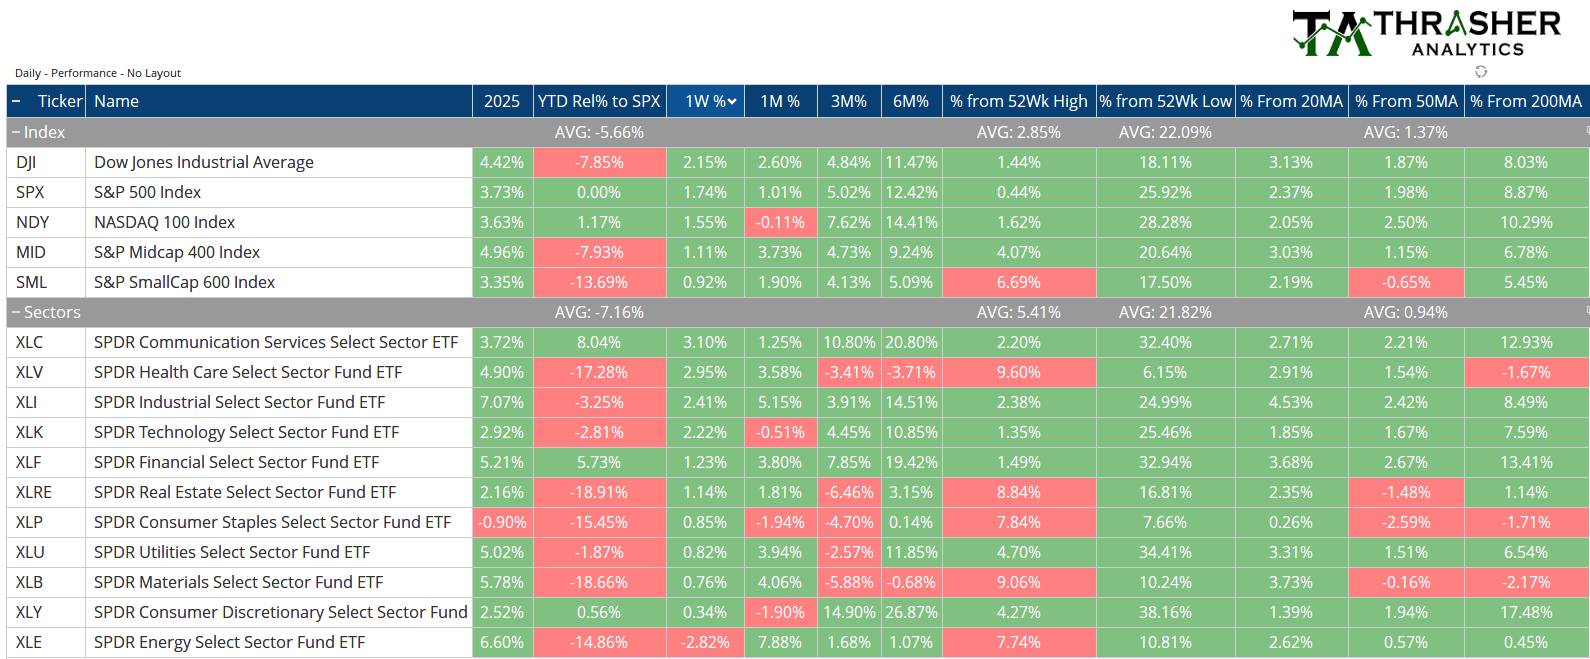
Index & Sector Performance Summary
Keep reading with a 7-day free trial
Subscribe to Thrasher Analytics to keep reading this post and get 7 days of free access to the full post archives.