

The market is closed on Monday in observe of President’s Day, giving traders a shortened week. The S&P 500 is -0.07% from an all-time high while the Nasdaq 100 did hit a high last week. The weekly SPX did make a new high but has an RSI that hasn’t breached 70 since July and is now at 62.5. The major highs in 2022, 2015, and 2007 all saw weekly RSIs of sub-64, making the current momentum indicator’s level a concern. An interesting development occurred last week for the Volatility Index, more details below in the Volatility section of this note. 55.5% of stocks are down 10% or more in the S&P 500 and there’s a lack of confirmation in the major Advance-Decline Lines. Breadth for U.S. equities remains narrow.
This week there are two Spotlight Charts, looking at YTD performance of individual stocks and a bullish divergence for one major commodity.
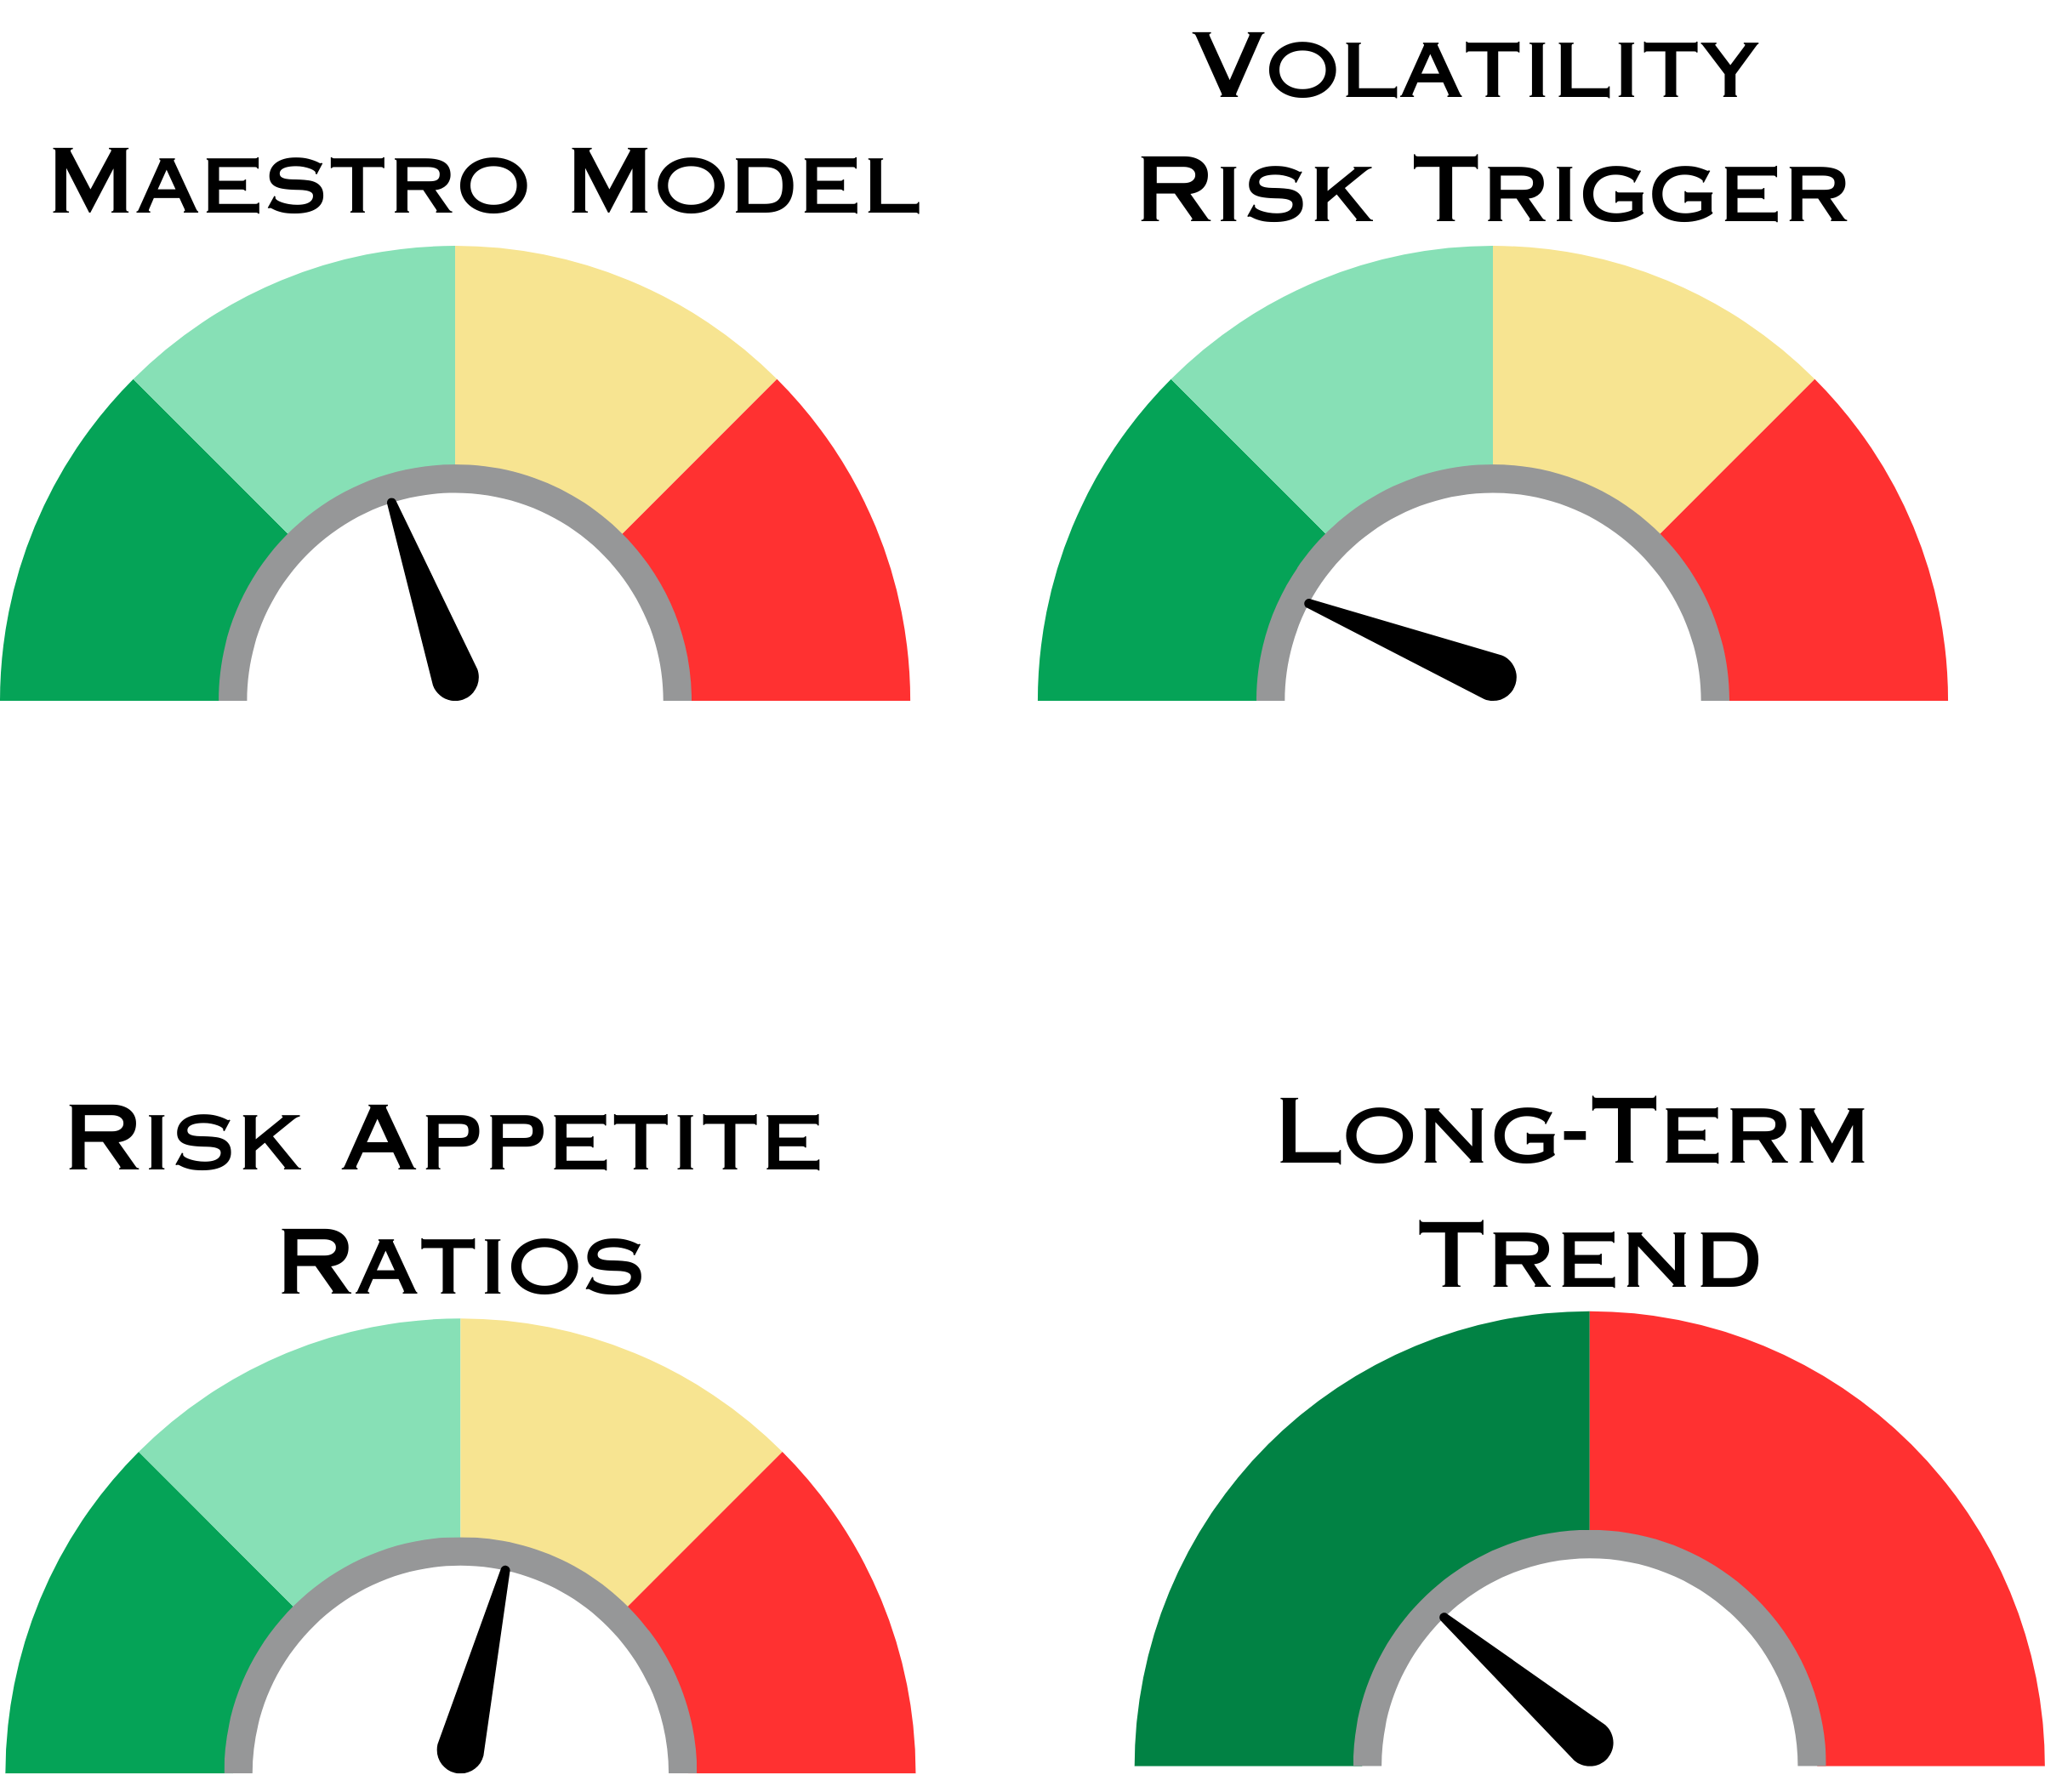
Summary of Models
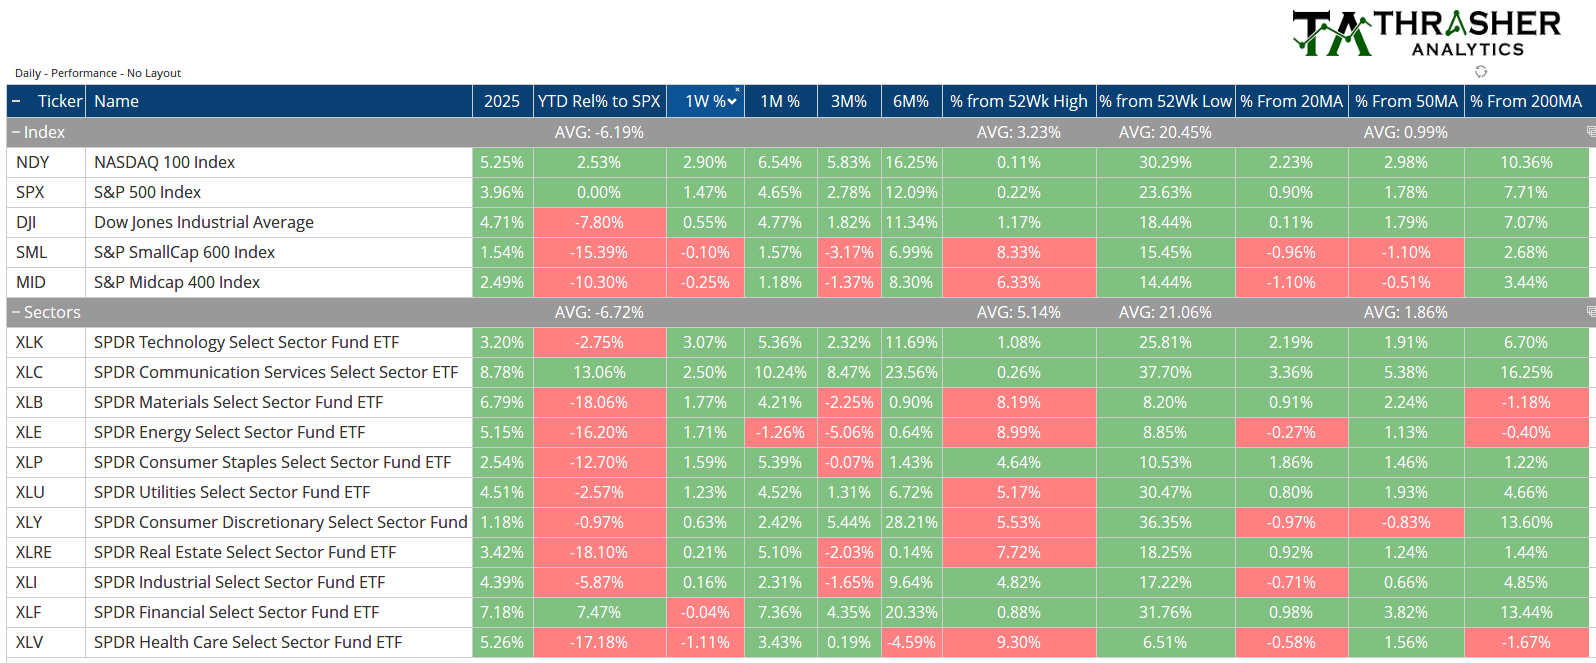
Index & Sector Performance Summary
Keep reading with a 7-day free trial
Subscribe to Thrasher Analytics to keep reading this post and get 7 days of free access to the full post archives.