

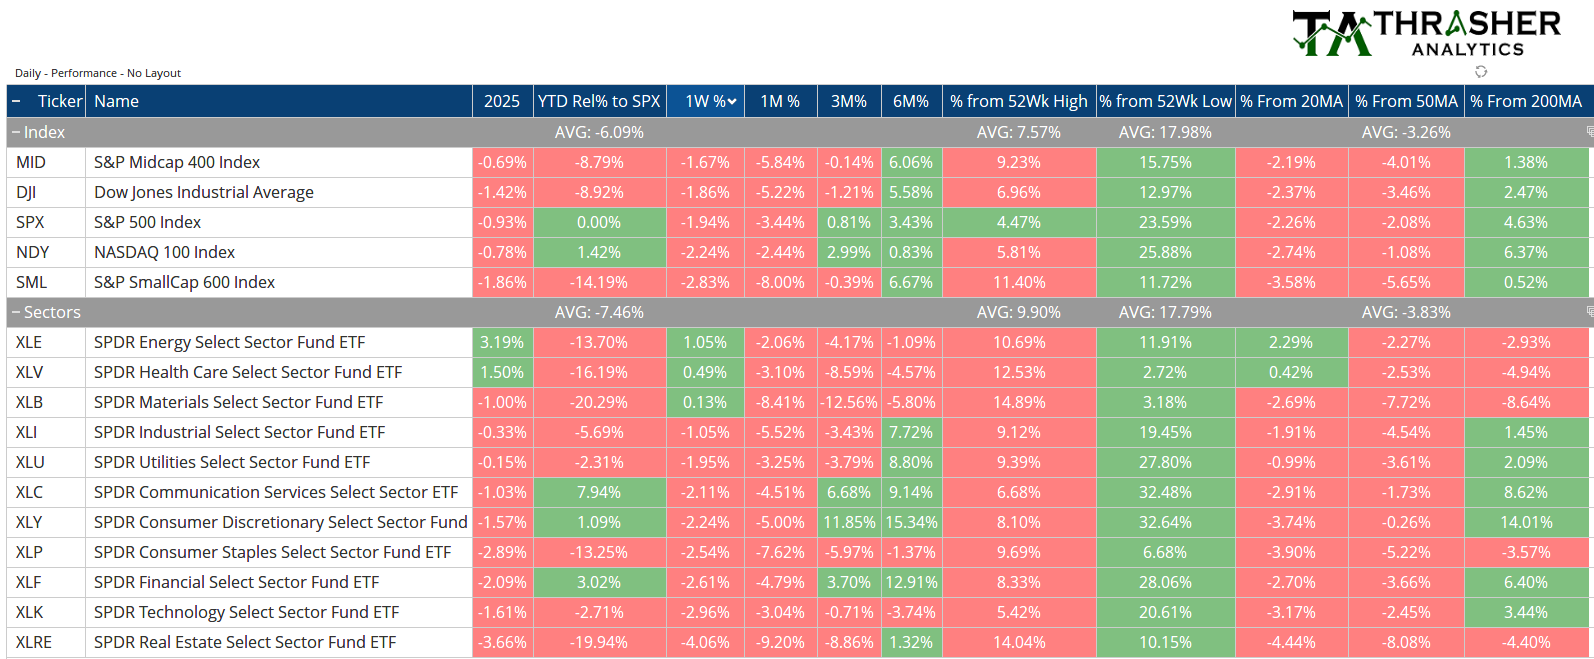
A rough week for U.S. equities, large caps are now down 4.3% and small caps have fallen -10.4% from their high. Last week was led by Energy and Health Care. Notable to see the strength in XLE following last week’s Spotlight Chart of the Breadth Thrust in the energy sector. The Index fell almost 2%% and XLE rose 1.05% last week. DJIA is now down -6.8% and took 10 days to do breach the -5% threshold while the S&P 500 is still down less than 5% and it’s been 22 days since its high. Friday saw almost 90% of stocks decline and less than half outperform, trading on Friday also ended with the fewest number of stocks above their respective 200-day moving average since November 2023. This week’s Spotlight Chart looks at a breadth chart of momentum levels in individual stocks as well as a second Spotlight Chart for one commodity.
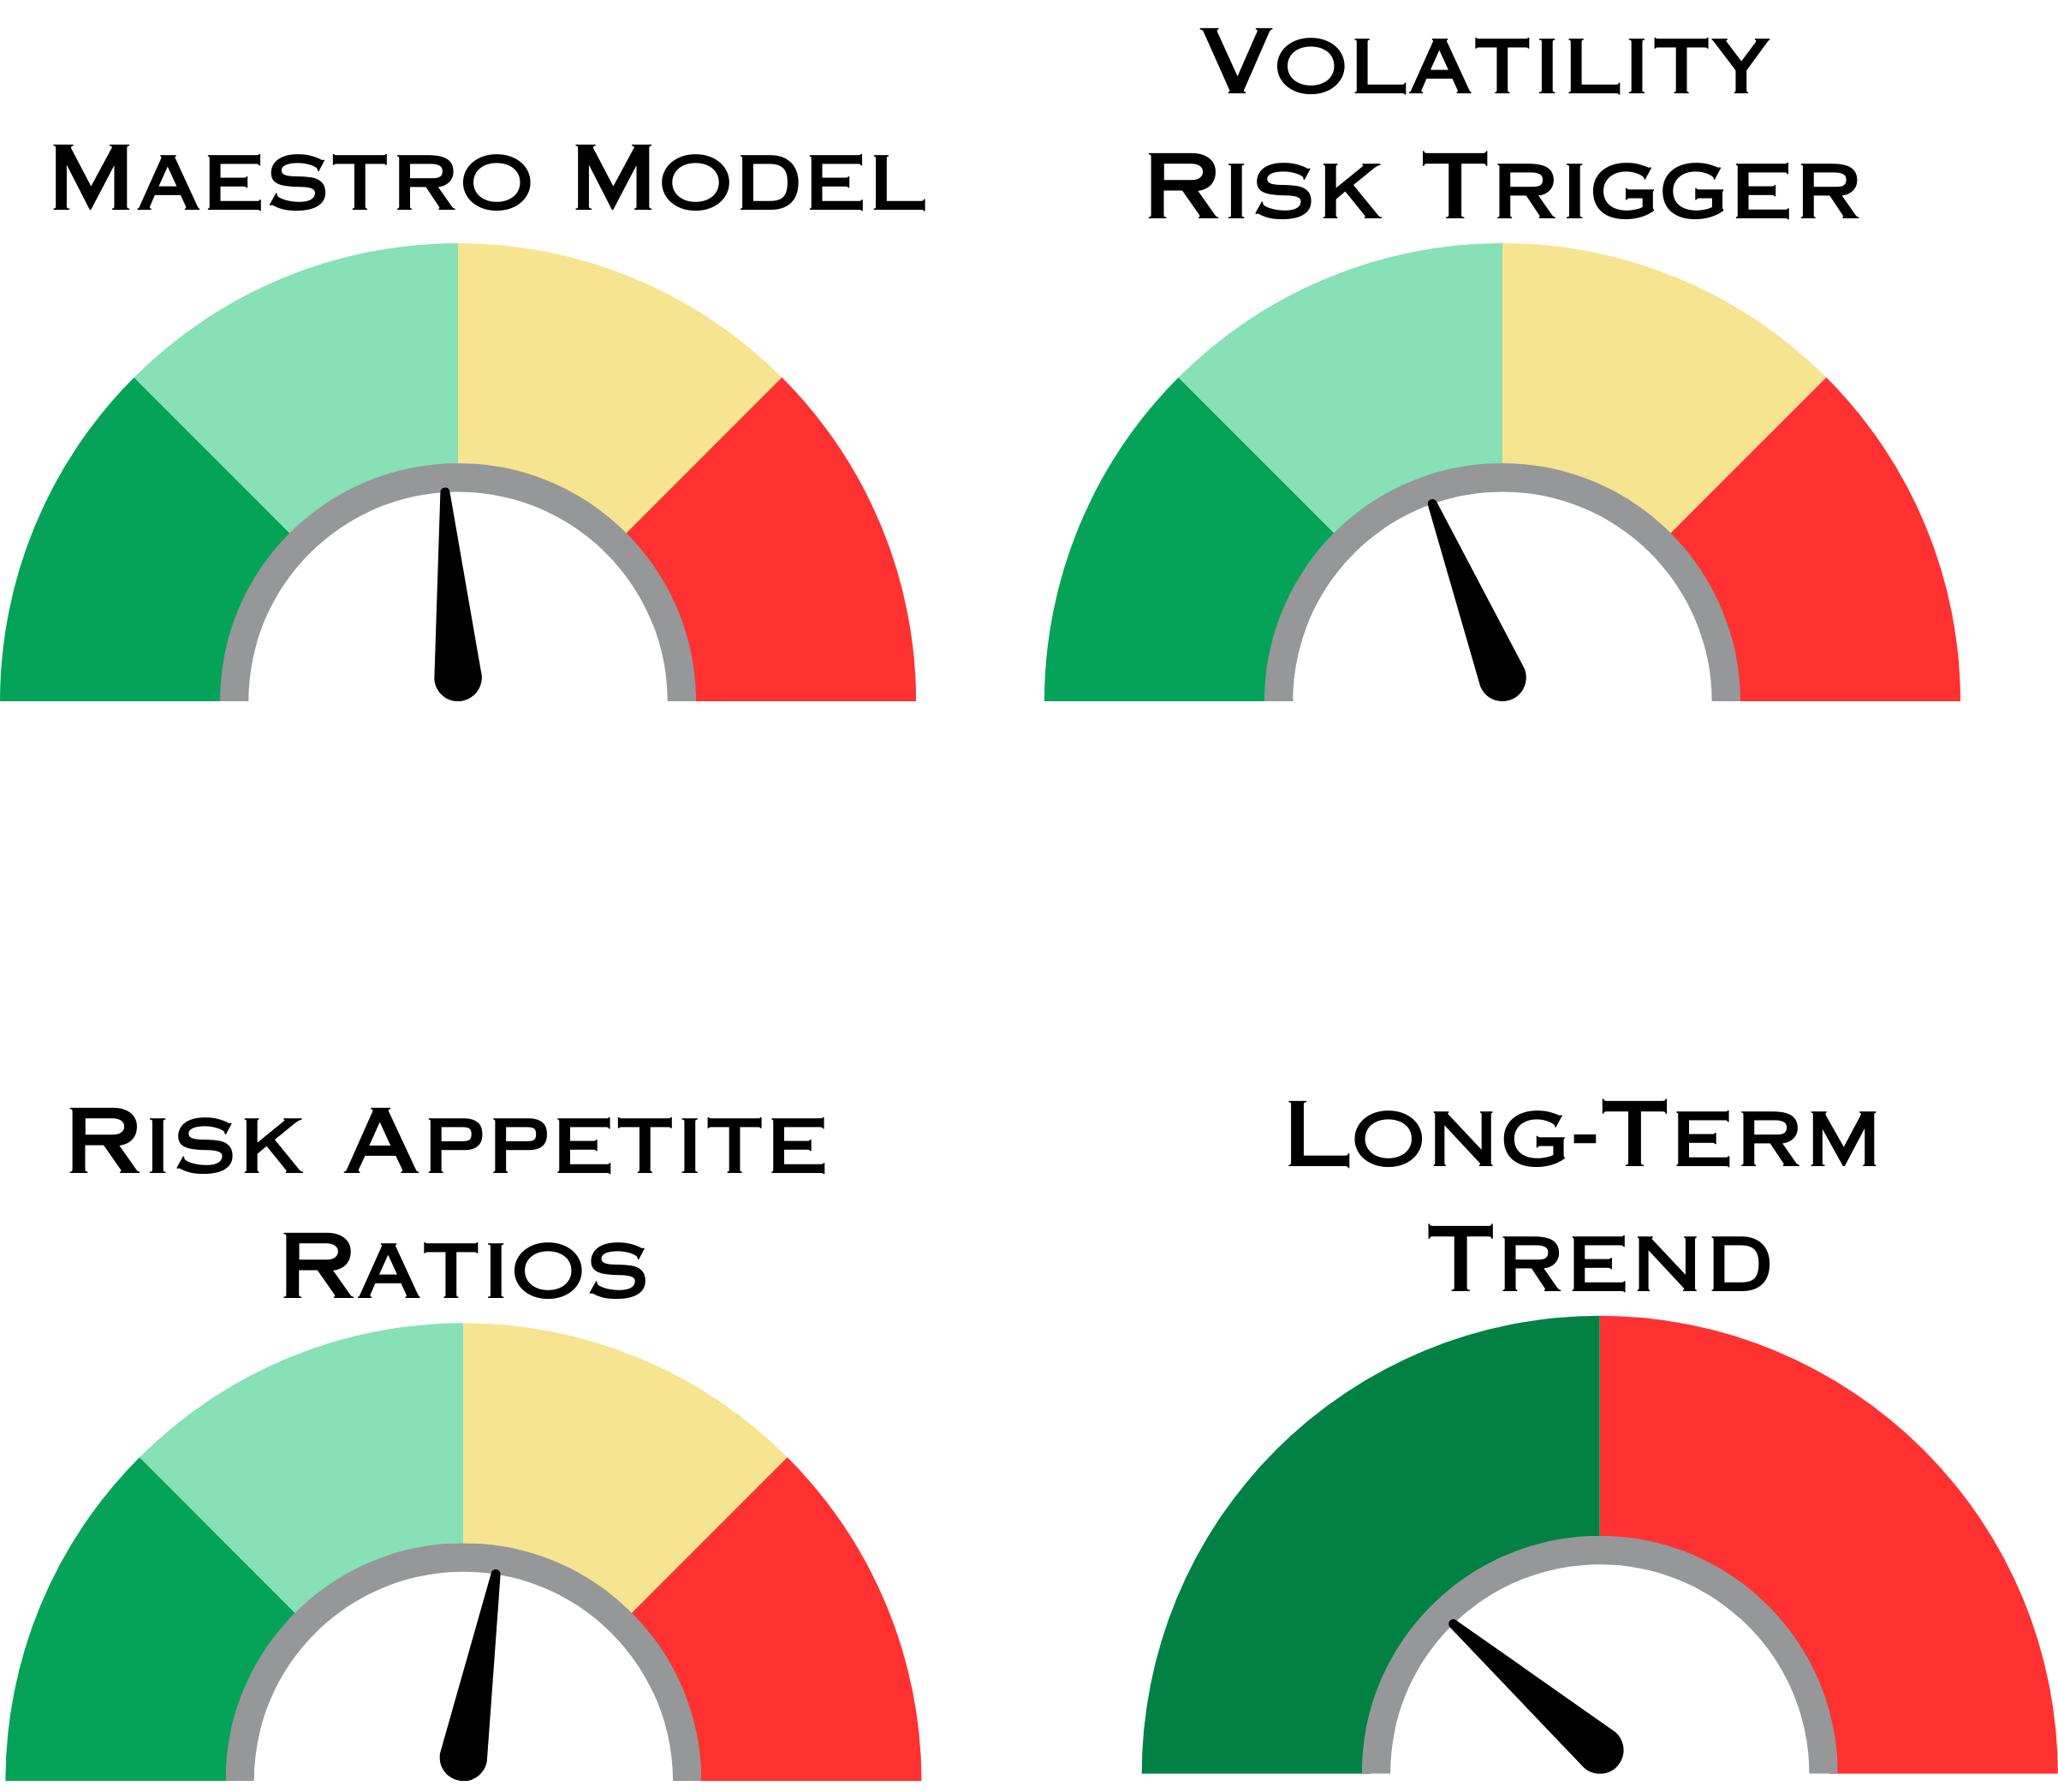
Summary of Models
Index & Sector Performance Summary
Keep reading with a 7-day free trial
Subscribe to Thrasher Analytics to keep reading this post and get 7 days of free access to the full post archives.