

Publishing Note: I appreciate the patience while I was away last week. I had planned for this note to go out on Monday but had a medical emergency with a family member that kept me at the Emergency Room part of the day and all night. They are doing well now, thankfully.
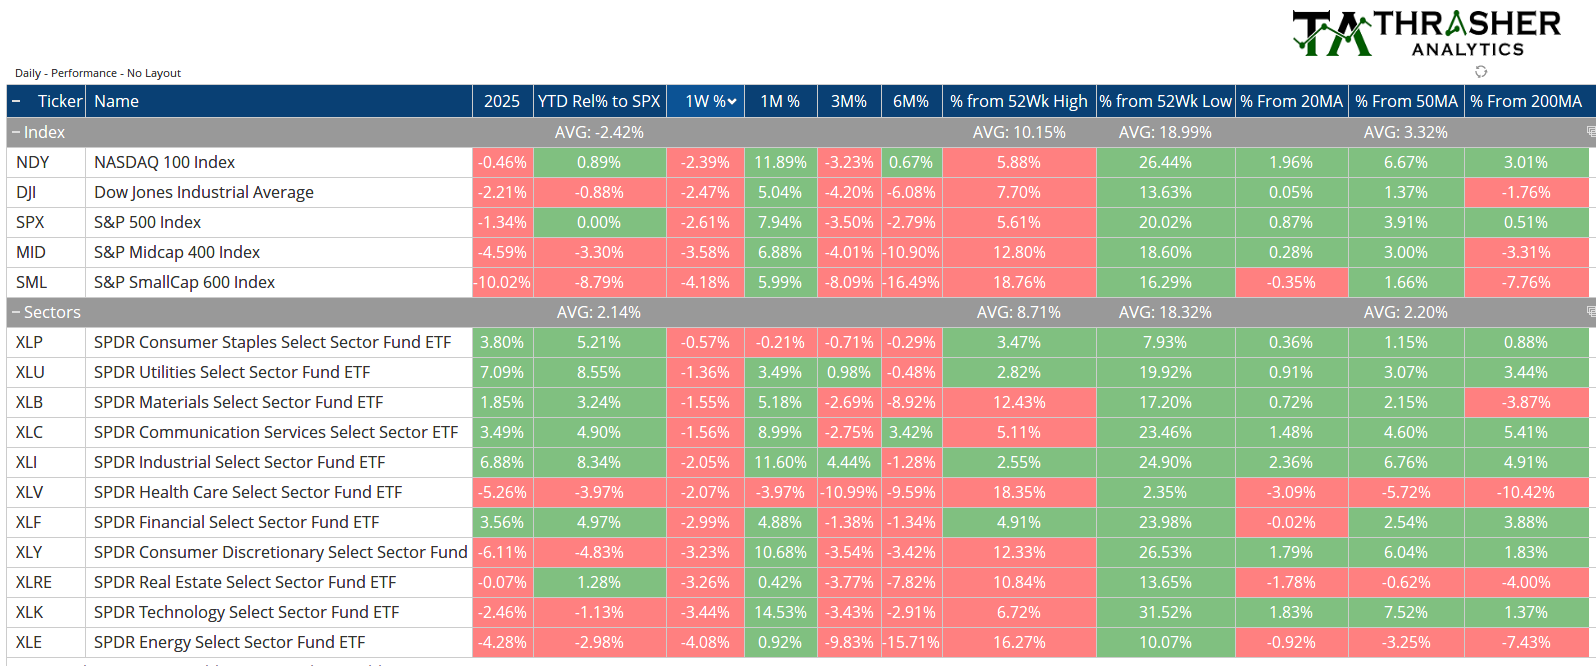
The S&P 500 finished lower last week by -2.61% with XLP, XLY, and XLB being the best performing sectors. Momentum had gotten extremely close to breaching the “overbought” level for the Index, the 14-day RSI hitting 69.96 before pulling back. SPX has held above the key 200-day MA but the Equal Weight S&P 500 failed to do so. 45.7% of stocks are still above their own long-term average.
Bitcoin has held up well, still trading above the 2024 closing highs. Gold also made a new recent weekly high, but this was not confirmed by its pricing in other major currencies. This week’s Spotlight Chart takes a look at sector relative performance and where strength is showing in in these 11 ratios.
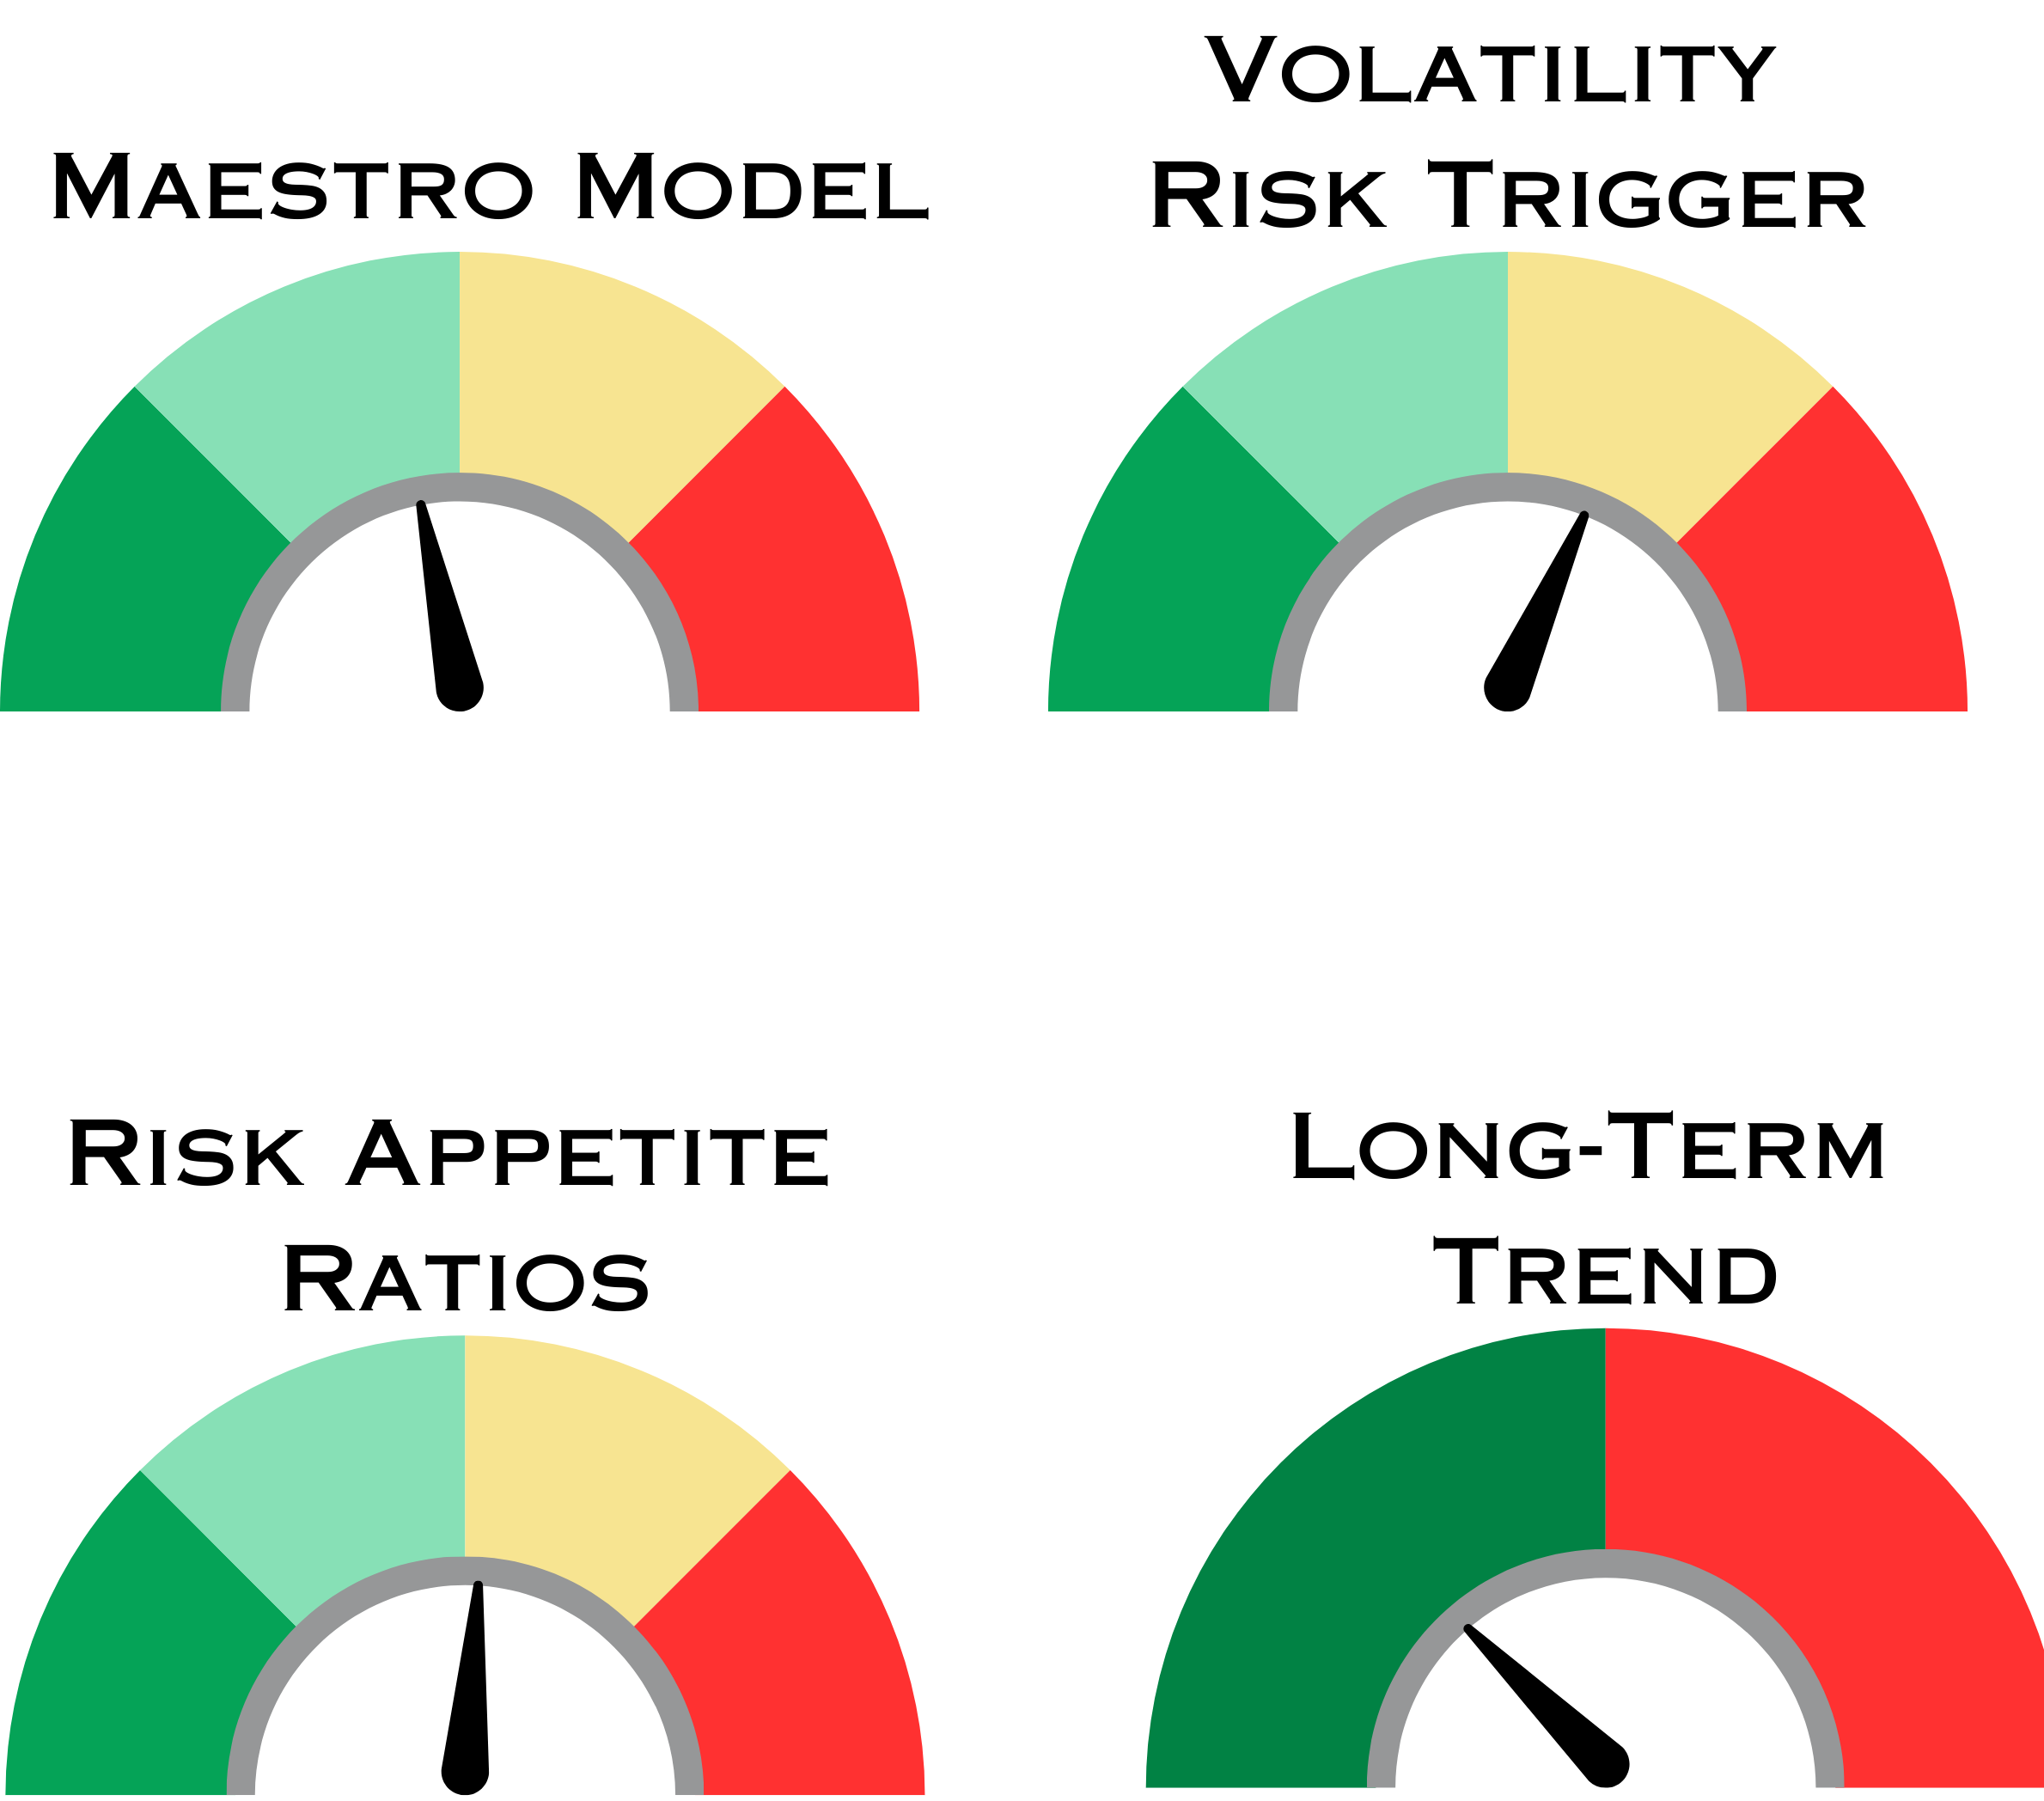
Summary of Models
Index & Sector Performance Summary
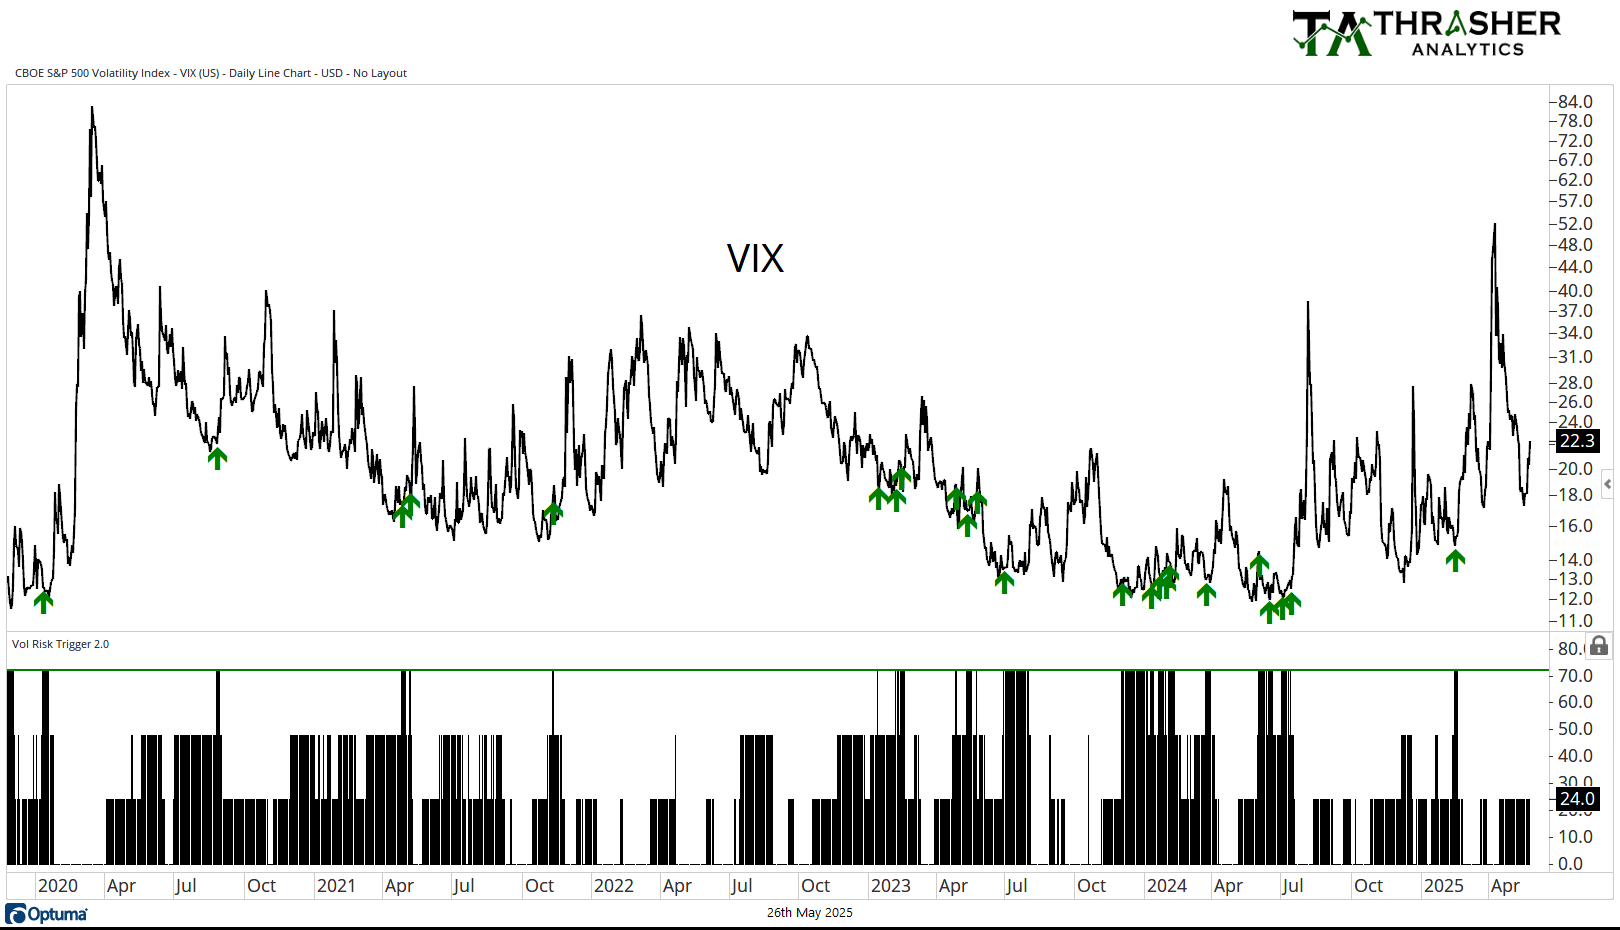
Volatility Risk Trigger
VRT remains at 24 with VIX seeing a slight uptick to 22.3 last week after been in the teens prior. VRT internals have been moving closer to a signal but aren’t at the thresholds yet.
Keep reading with a 7-day free trial
Subscribe to Thrasher Analytics to keep reading this post and get 7 days of free access to the full post archives.