

Updated Models & Spotlight Chart 6/15/2025
Are Traders About to Abandon High Beta Stocks?
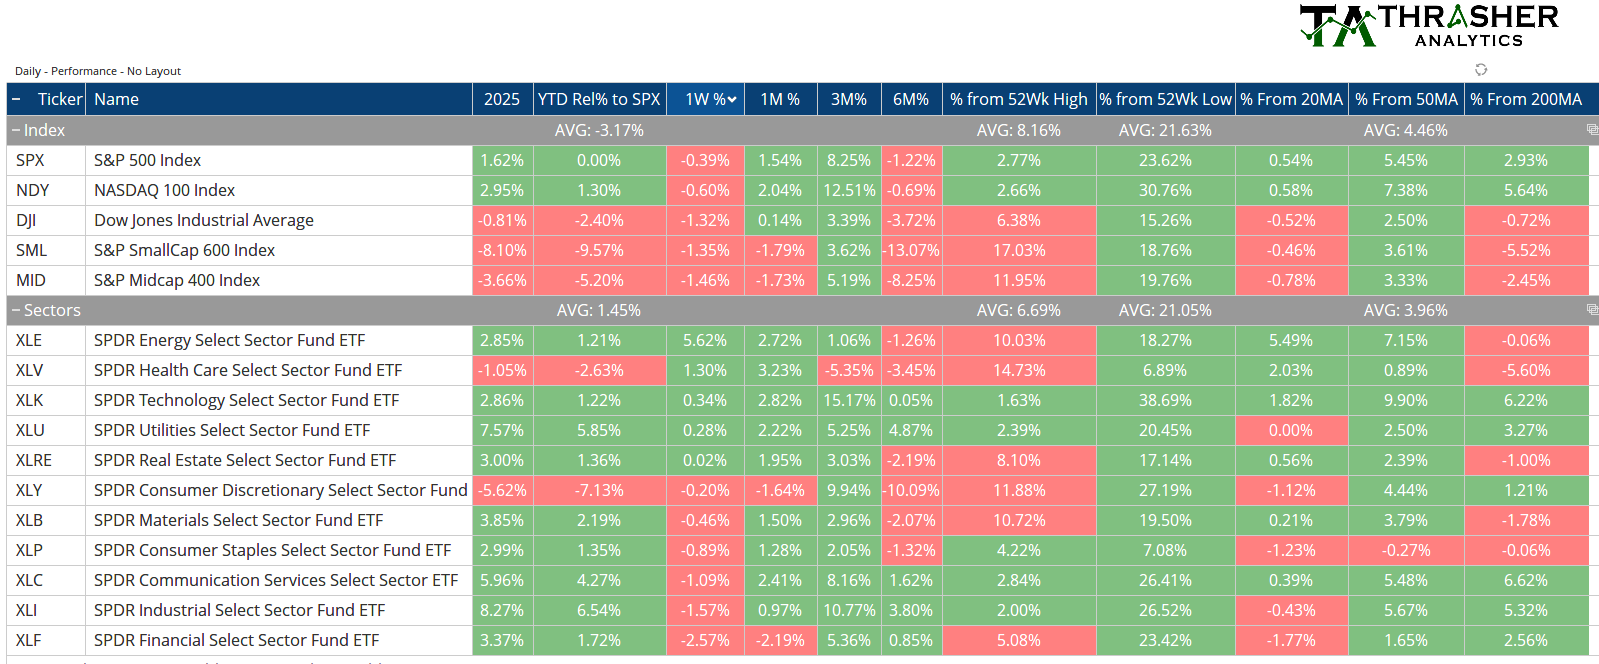
The S&P 500 fell 0.39% last week with the strongest sectors being XLE, XLV and XLK. The week ended with 86% of stocks declining on Friday and a growing divergence in short-term breadth based on the % of stocks above the 20-day moving average as well as the trend direction in the 5-day and 21-day Advance-Decline Lines. Headlines shift once again from tariffs and economic implications to middle east conflict with Isreal and Iran firing missiles at one another. Mega caps continue to be where the strength is for the domestic market as equal weight and small caps lag. This week’s Spotlight Charts look at outperformance data and one key relationship to show trader sentiment and why it appears to be turning.
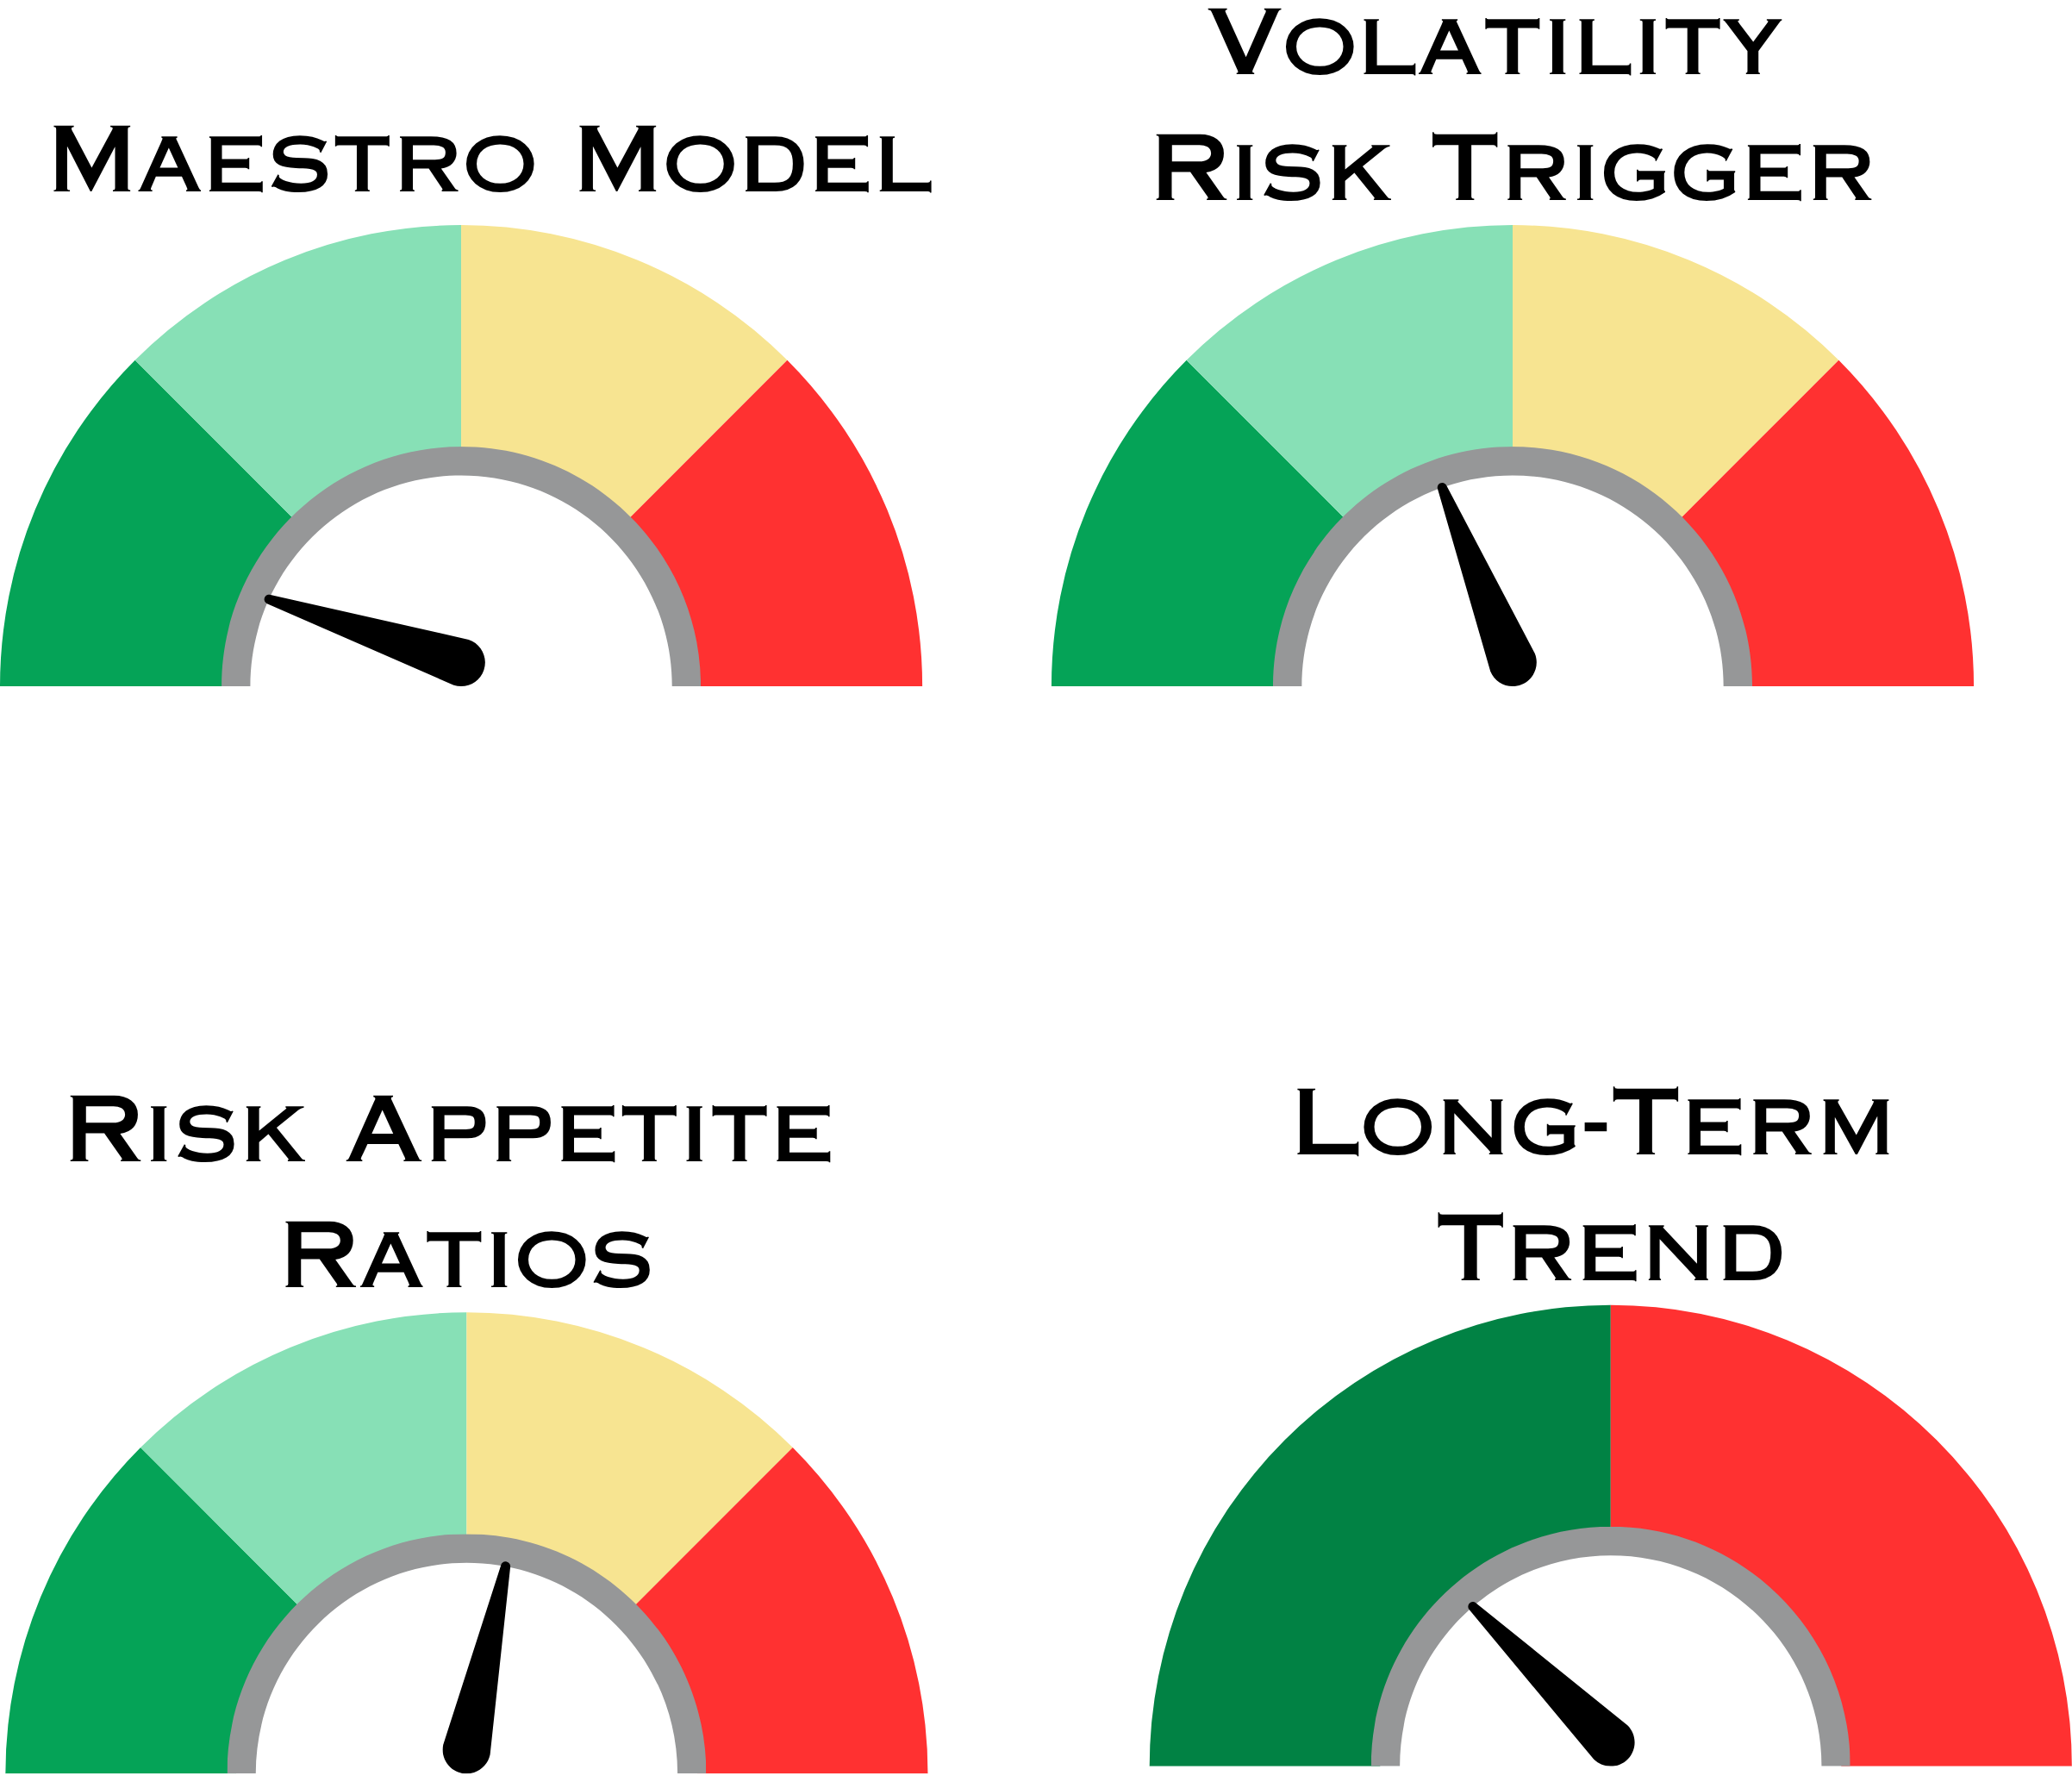
Summary of Models
Index & Sector Performance Summary
Volatility Risk Trigger
VRT remains at 48, still below the threshold for a signal.

Keep reading with a 7-day free trial
Subscribe to Thrasher Analytics to keep reading this post and get 7 days of free access to the full post archives.