

Updated Models & Spotlight Chart 6/29/2025
Sector Breadth Confirms Bullish Price Action While The Avg Stock Is Still Deep in Drawdown
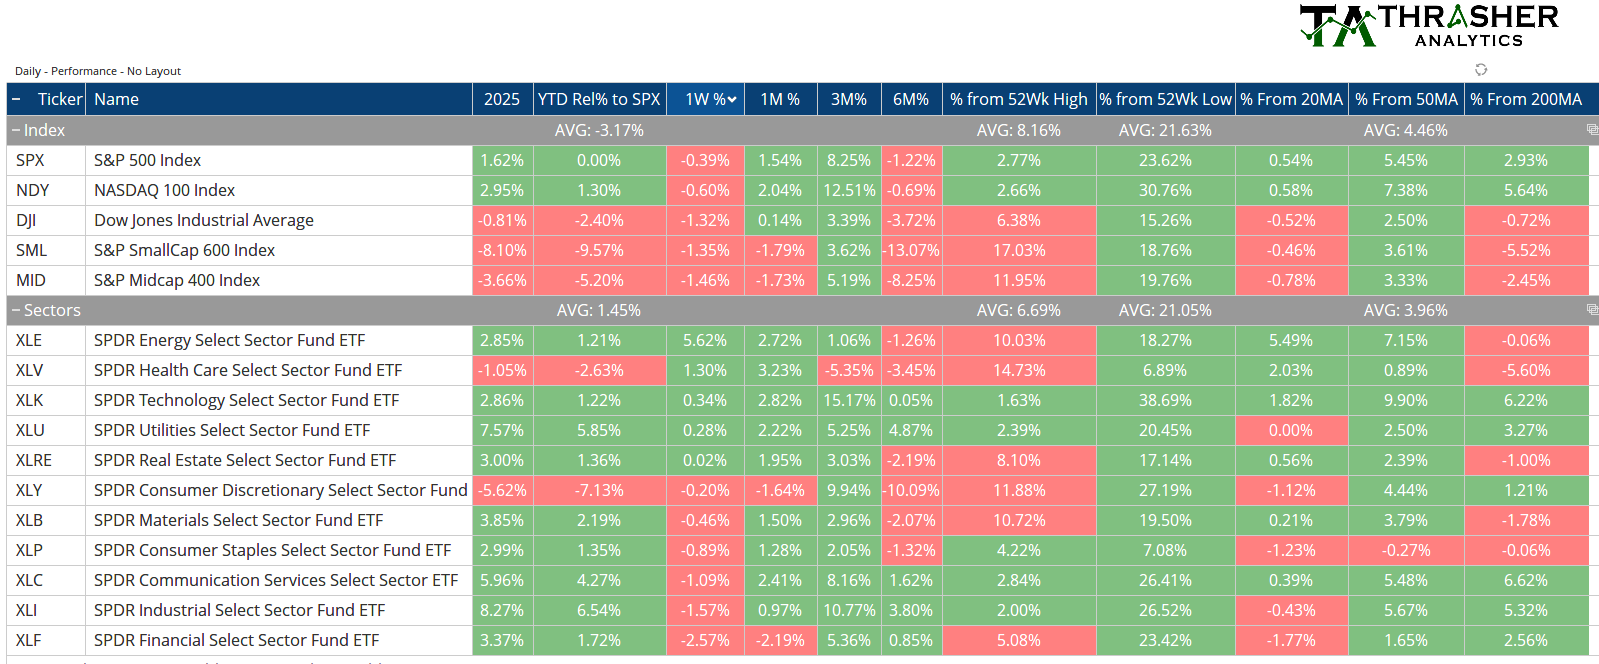
The S&P 500 is up 3.44% over the last week with leadership from XLC, XLK, and XLY sectors. The large cap index hit a new high, and mid caps are still down 8.5%. Leading groups like tech, growth, and Nasdaq 100 all joined the SPX in making a new high. From a breadth perspective, we still don’t have expansion in long-term breadth, but the S&P 500 Advance-Decline Line did make a new high but has not been joined by the S&P 1500 and NYSE A-D Lines. The Mag 7 and Equal Weight also have yet to hit a new high. This week’s Spotlight Charts look at how the breadth landscape is shaping up from a risk appetite sector perspective and the second chart evaluates the drawdown recovery progress for stocks.
Summary of Models

Index & Sector Performance Summary
Volatility Risk Trigger
VRT below is from last week, VIX has some issues at data provider.

Keep reading with a 7-day free trial
Subscribe to Thrasher Analytics to keep reading this post and get 7 days of free access to the full post archives.