

Updated Models & Spotlight Chart 3/16/2025
SPX Trend Turns Negative But A Few Bright Spots Remain
By Thursday, the S&P 500 has fallen -10%. Which comes after Weds. I wrote a special note looking for a bounce. Friday got a 2% rally in the index, with 90% of stocks moving higher but most still remain under their long-term averages. The Index is down just over -4% YTD and only 43% of stocks are still positive for the year. Bitcoin, a barometer for risk is testing its 40-week moving average, I’m watching if this can hold, and the uptrend remain intact. There are still a few bullish developments in the domestic equity market which are discussed in the two Spotlight Chart’s in this week’s note. However, the S&P 500 trend has moved negative. I still think we can see some counter-trend rallies and I’m watching breadth stats and price action to determine if they have any durable as well as if we get any clusters of Breadth Thrusts, which would show up on the Breadth Thrust Composite chart I share twice a week.
This week’s Spotlight Charts looks at the 5% Canary signal and what I’m watching going forward as well as some important Advance-Decline lines that are breaking away from the price action of the Index in the short-term after leading the market into the latest peak.
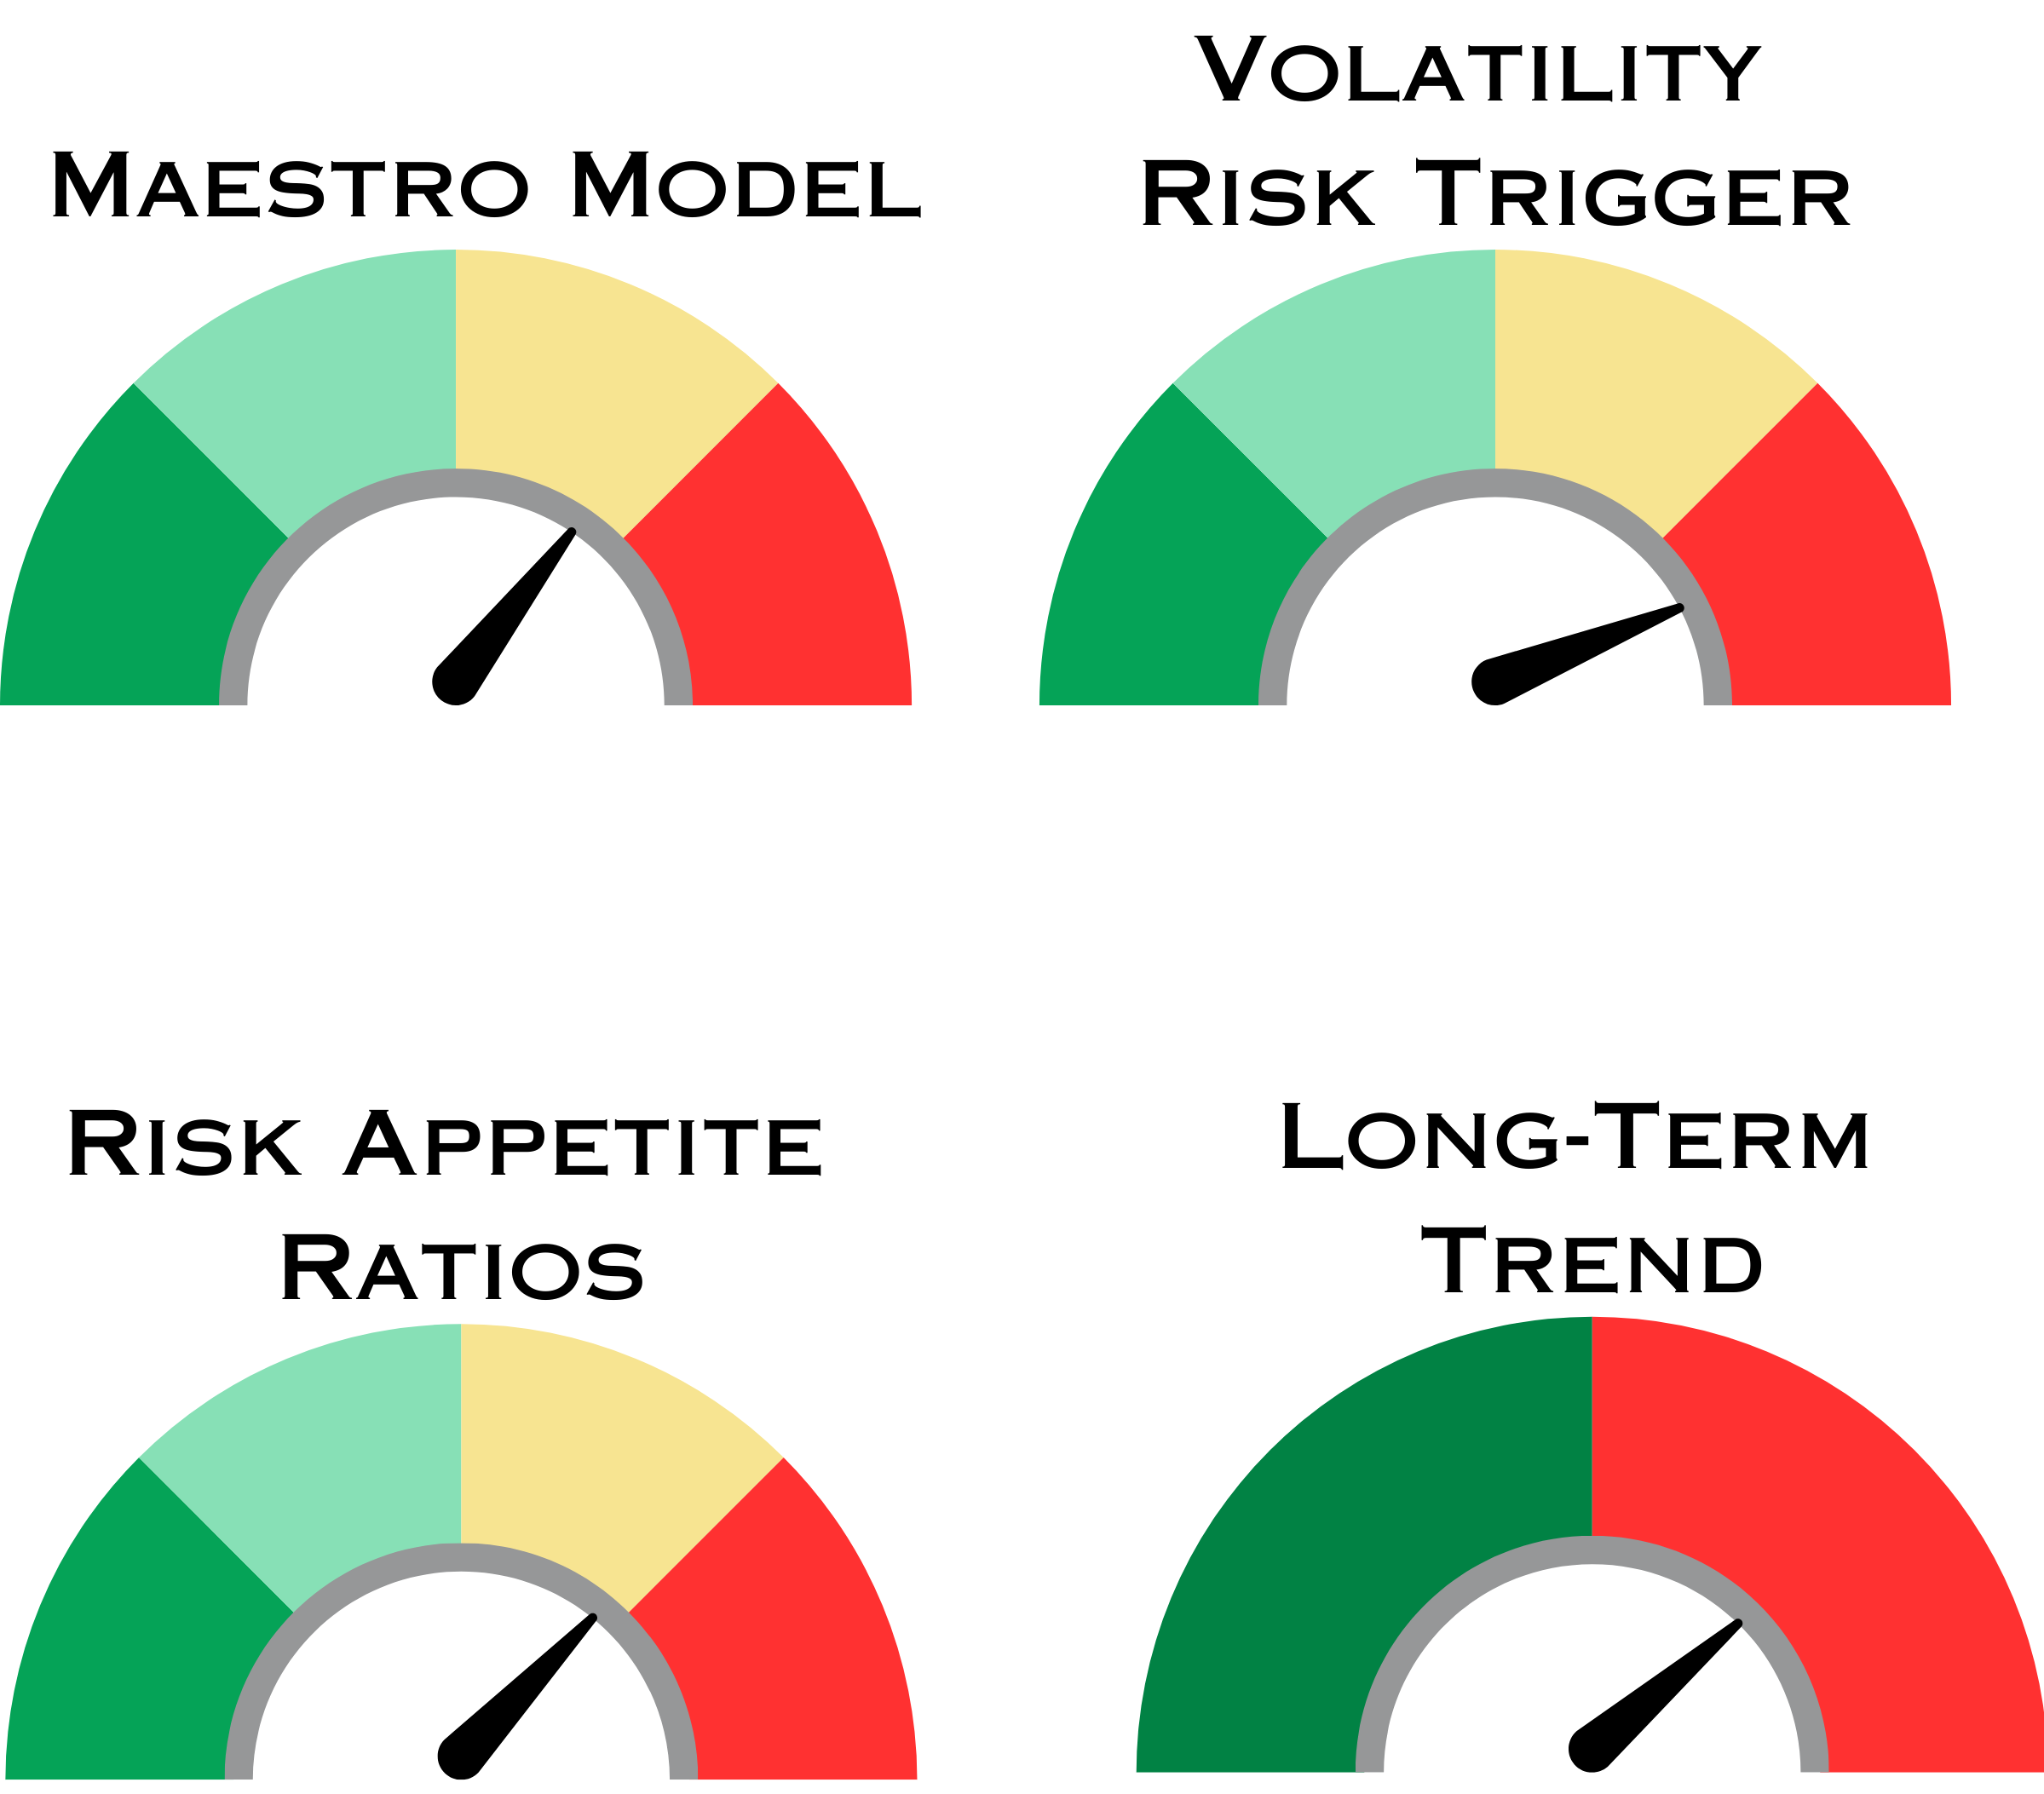
Summary of Models
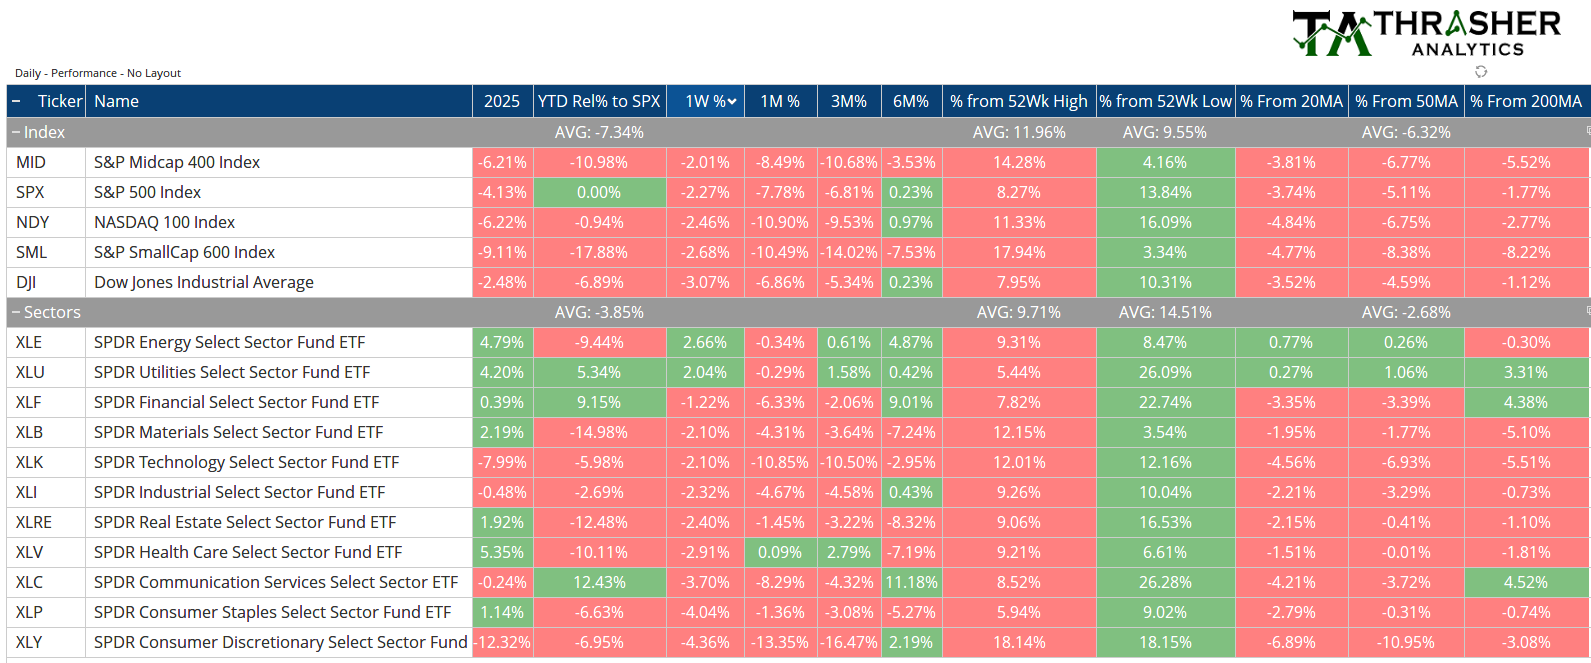
Index & Sector Performance Summary
Keep reading with a 7-day free trial
Subscribe to Thrasher Analytics to keep reading this post and get 7 days of free access to the full post archives.