

Updated Models & Spotlight Charts 7/6/2025
Intermediate Breadth Confirms Advance as Index Becomes Short-Term Stretched
The S&P 500 was up again, this time by 2.25% for a short holiday week led by XLB, XLY, and XLI. Both the Maestro Model and Risk Barometer increased. I’ve written several times about the significance of 6-month highs breaching 10%, which did occur last week as it hit 12.55%. Few stocks are moving lower on heavy volume, sending the volume ratio to the lowest level since June 2020 which is one of the Spotlight charts for this week. I also take a look at a bullish chart for crude oil and intermediate breadth that’s confirming the advance in the S&P 500. Sentiment is currently getting a little frothy and the trend is becoming stretched, but we are seeing breadth broaden out which is a positive sign.
Summary of Models
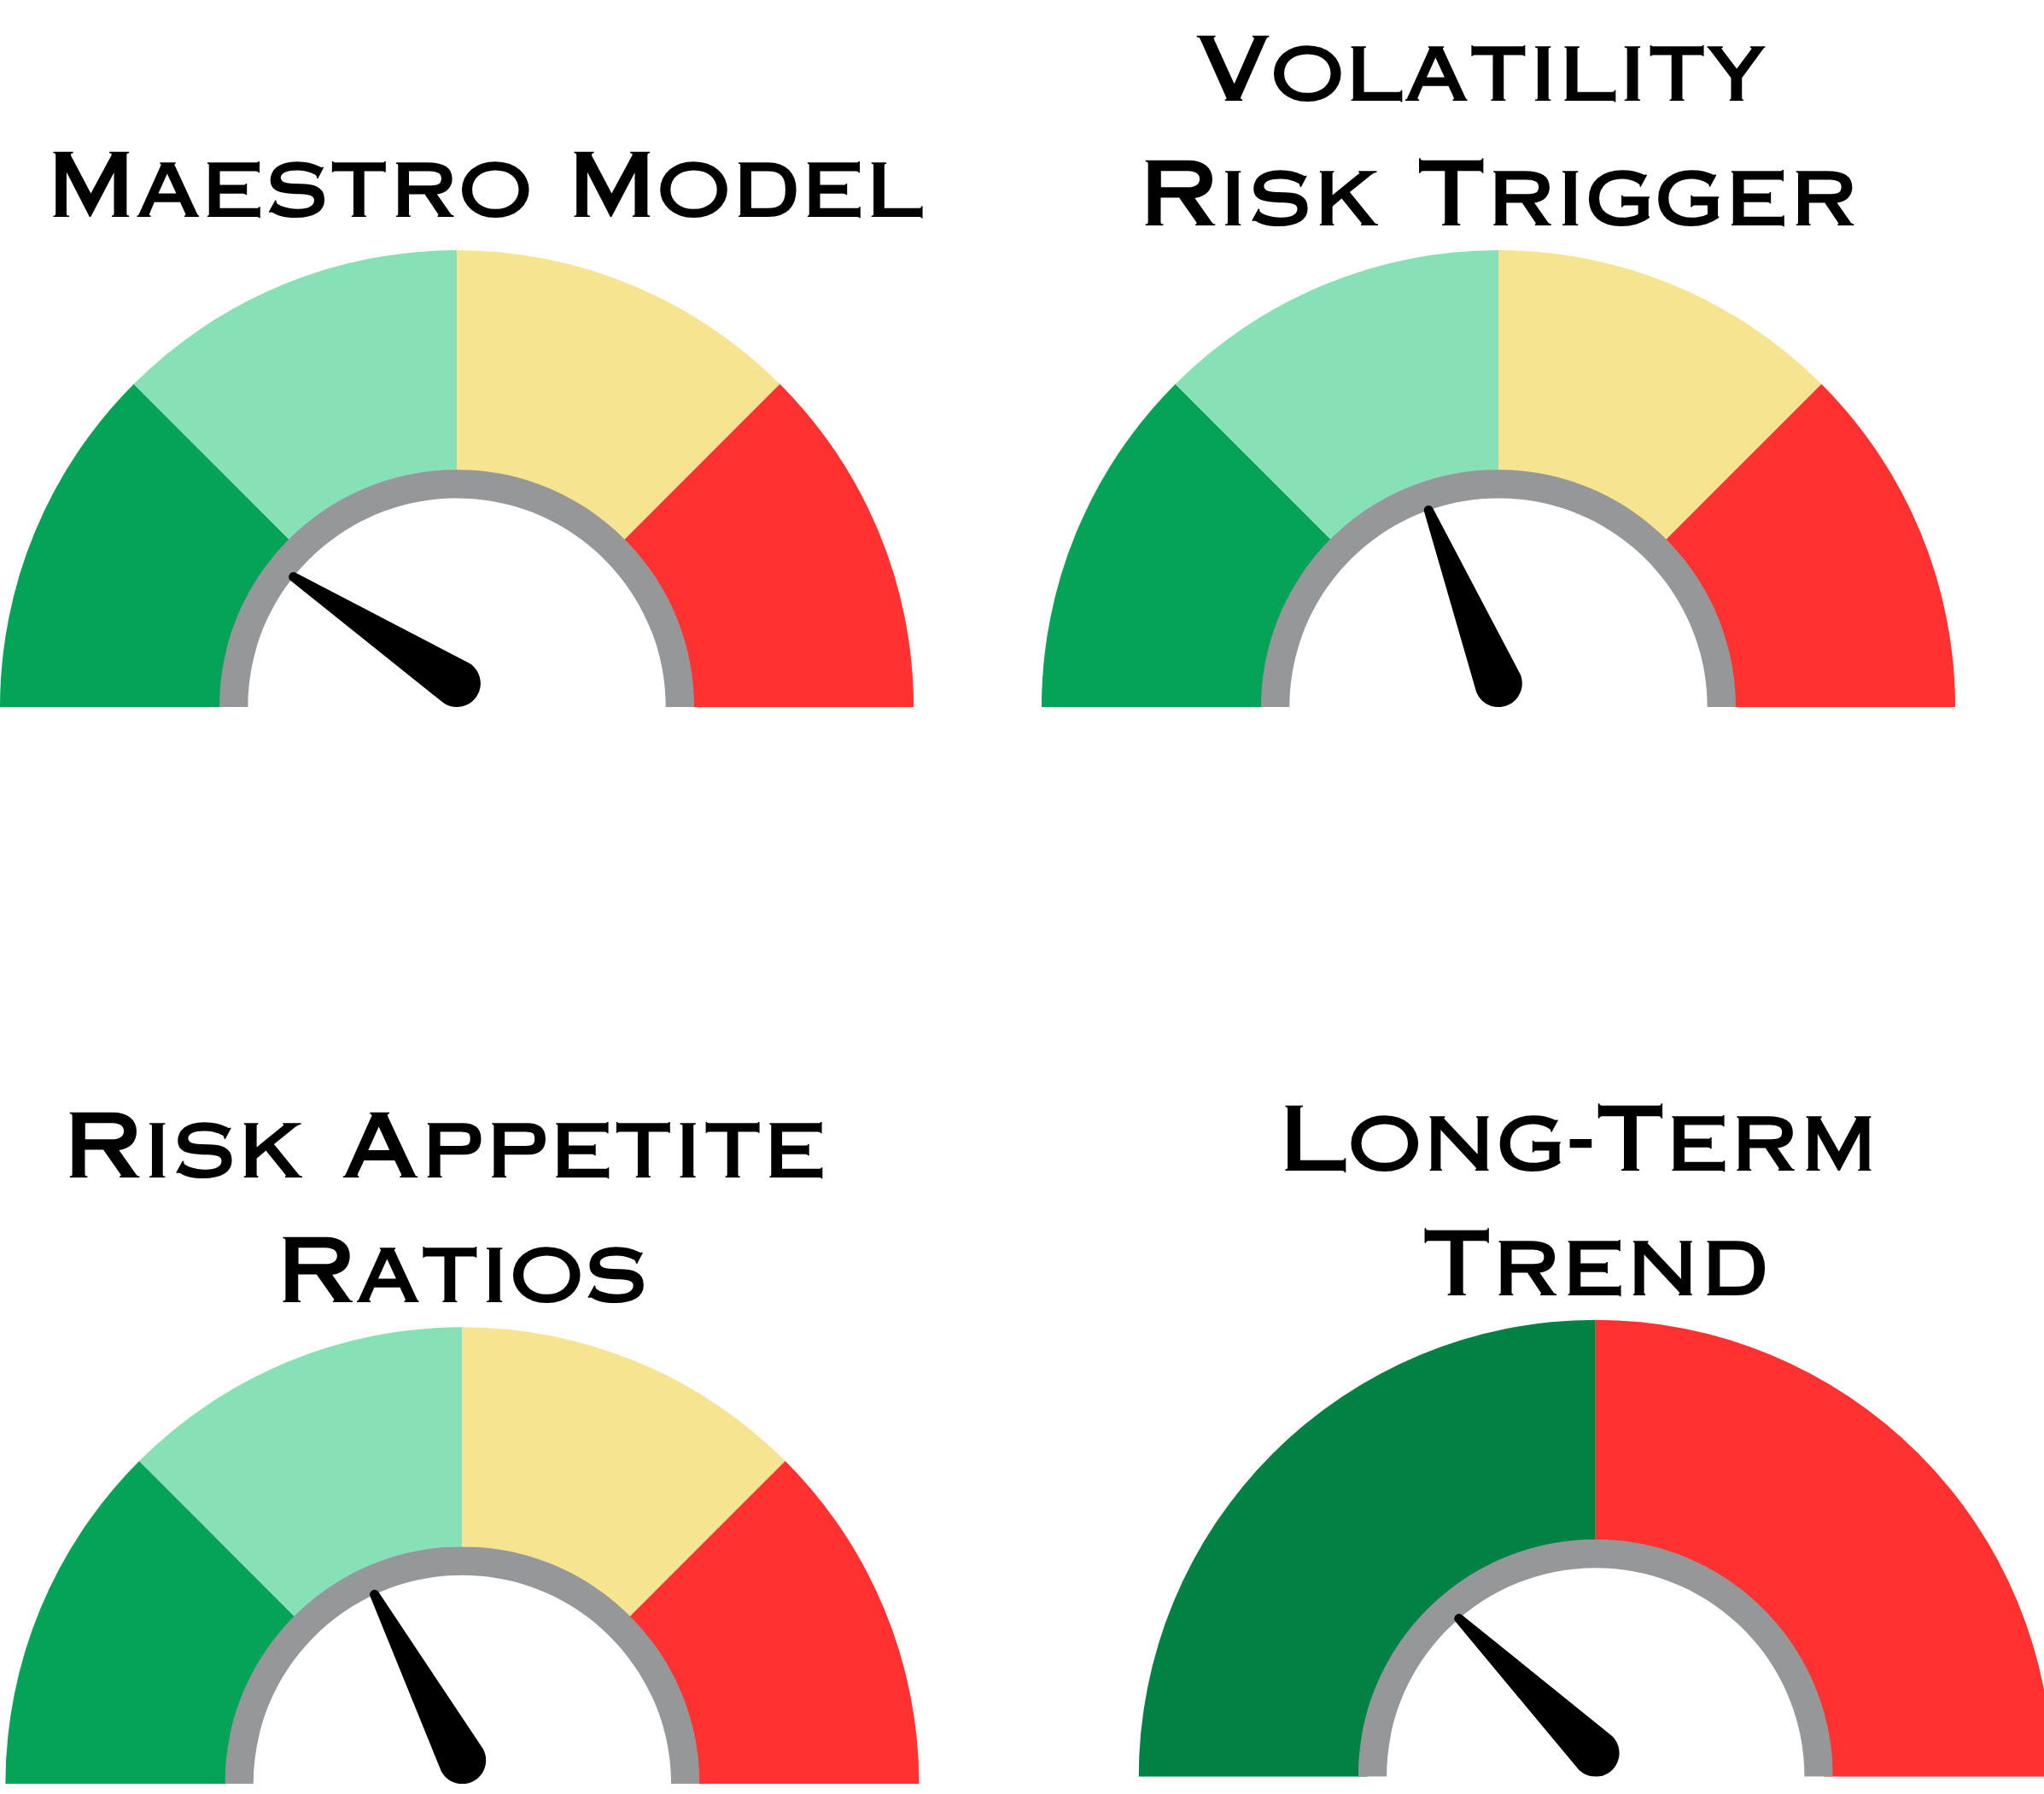
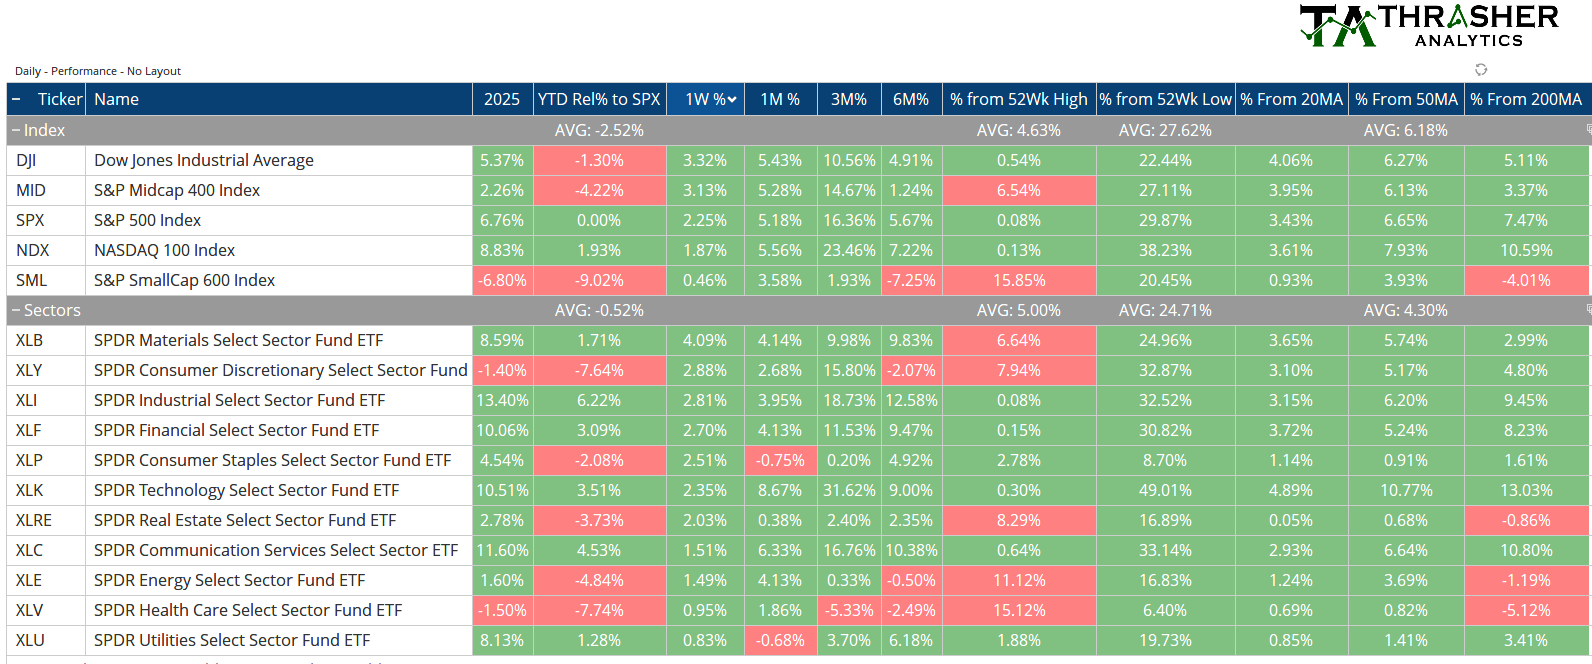
Index & Sector Performance Summary
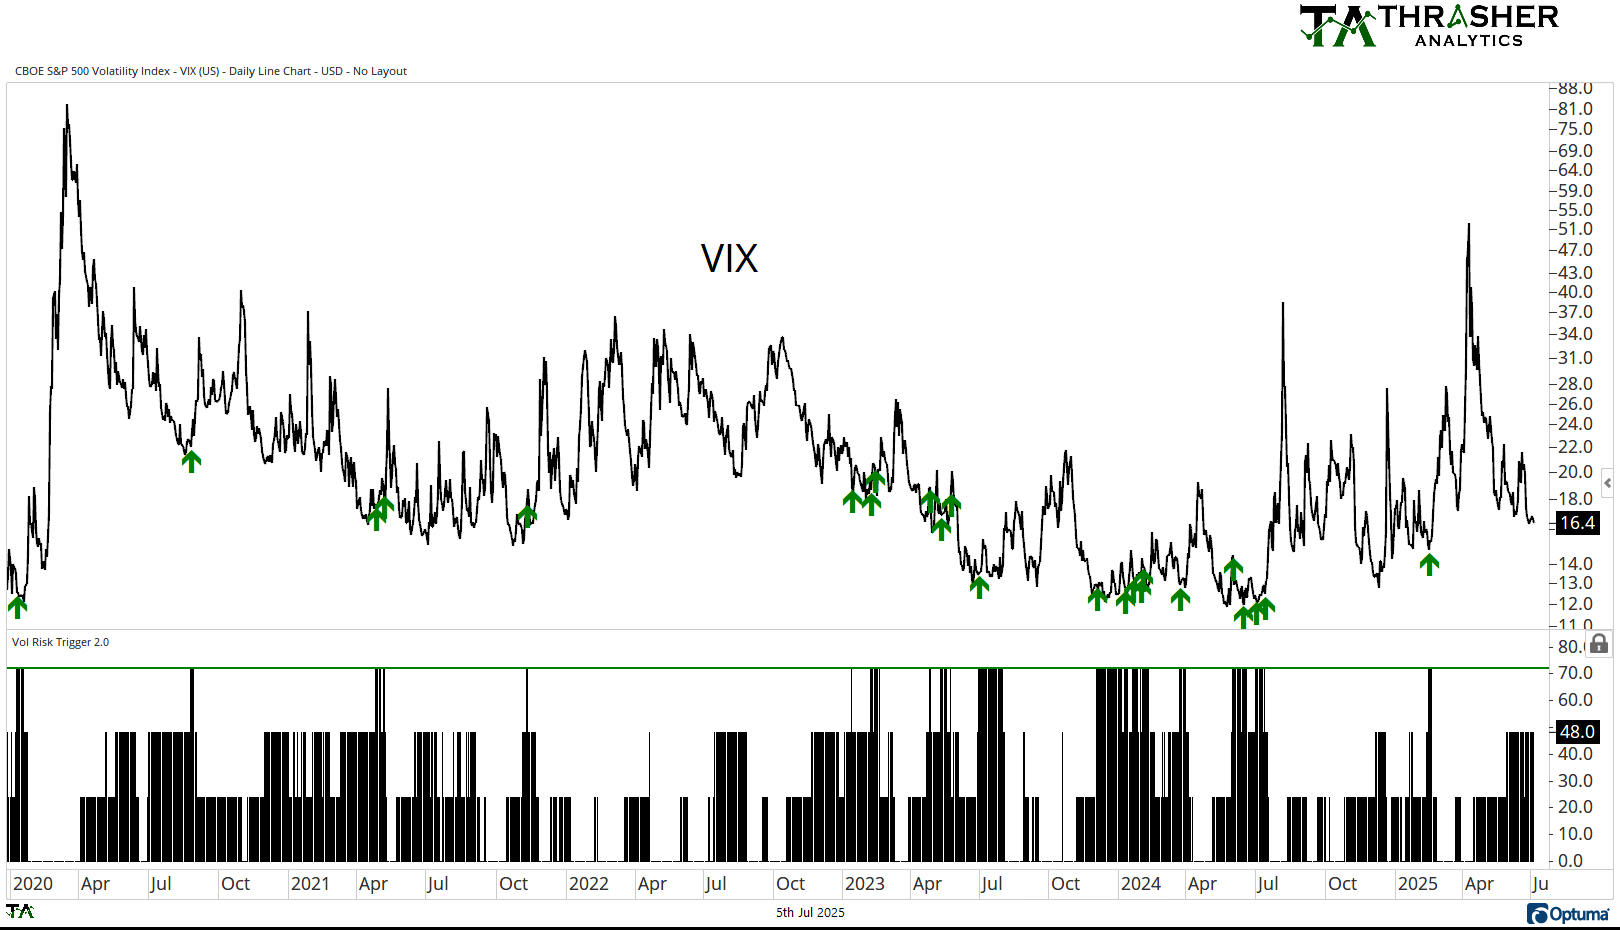
Volatility Risk Trigger
VRT remains at 48, below the threshold for a signal.
Keep reading with a 7-day free trial
Subscribe to Thrasher Analytics to keep reading this post and get 7 days of free access to the full post archives.