

Updated Models & Spotlight Charts 7/13/2025
Short-Term Stretched With Several Sectors Beginning to Shift in Relative Performance
The S&P 500 had some slight weakness last week, falling -0.31% with XLE, XLU and XLI being the best performing sectors. Friday was a 78% down day for large cap stocks which comes after an 81% down day on Monday. Despite the misstep in stocks, the Maestro Model and Risk Appetite models both improved. Last week’s chart on declining volume was highlighted in a Bloomberg article. This week’s Spotlight Charts look at the stretched condition in price for a major index and the short-term bearish implications that condition has had in the past. The second Spotlight Chart checks in on the relative performance of the large cap sectors and some key developments happening in their trends.
Summary of Models

Index & Sector Performance Summary

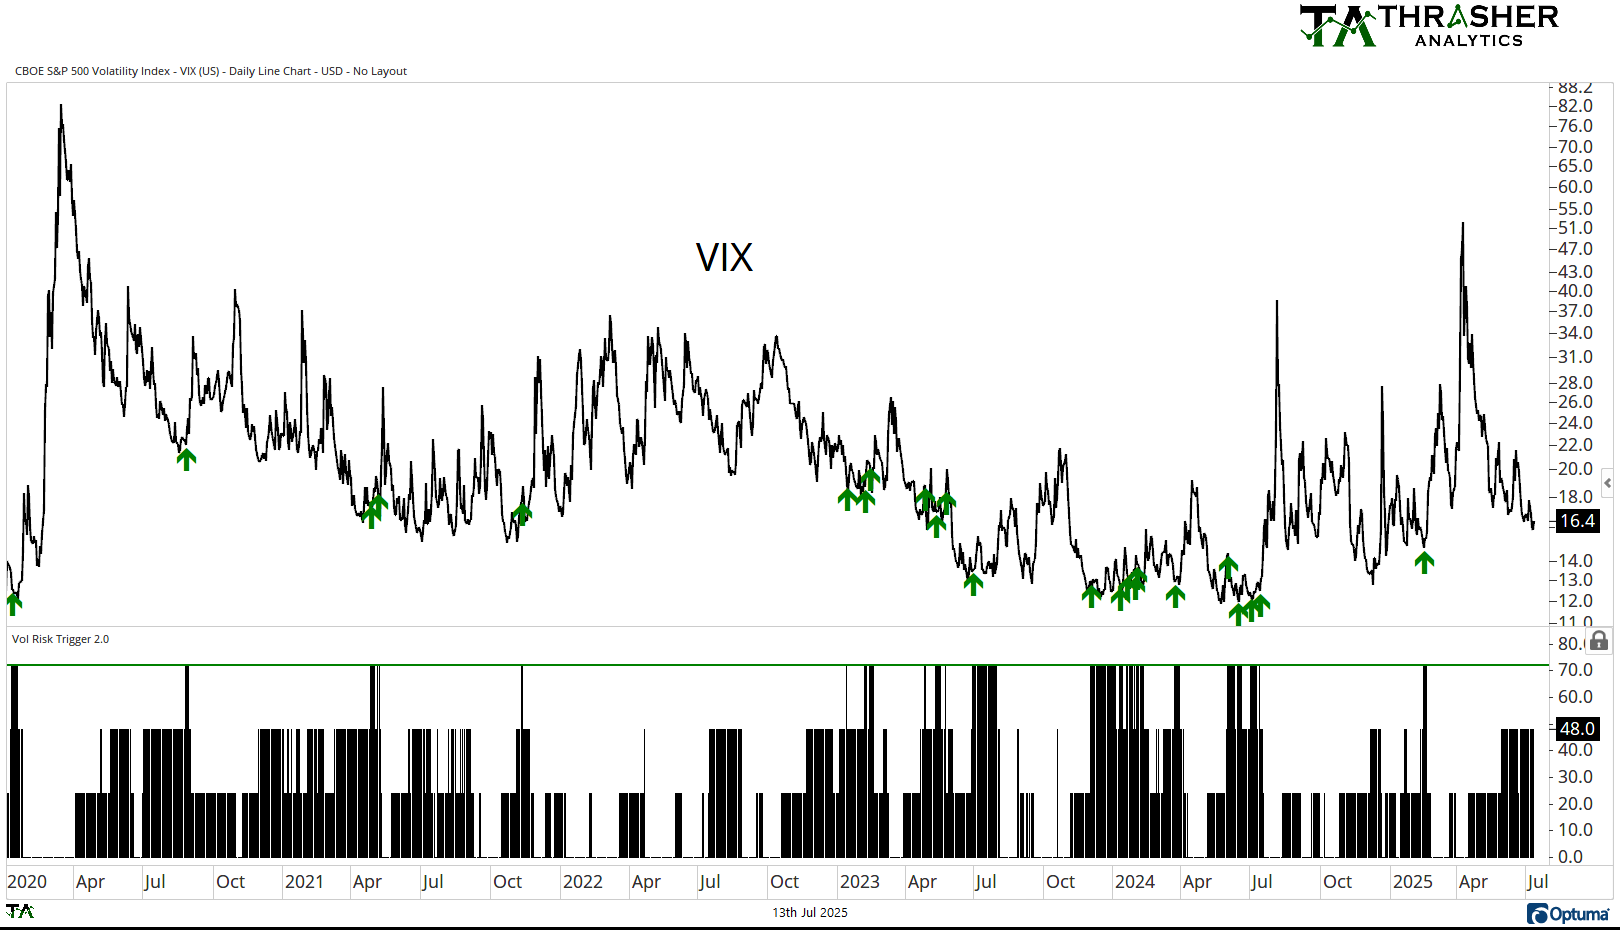
Volatility Risk Trigger
VRT remains at 48, below the threshold for a signal.
Keep reading with a 7-day free trial
Subscribe to Thrasher Analytics to keep reading this post and get 7 days of free access to the full post archives.