

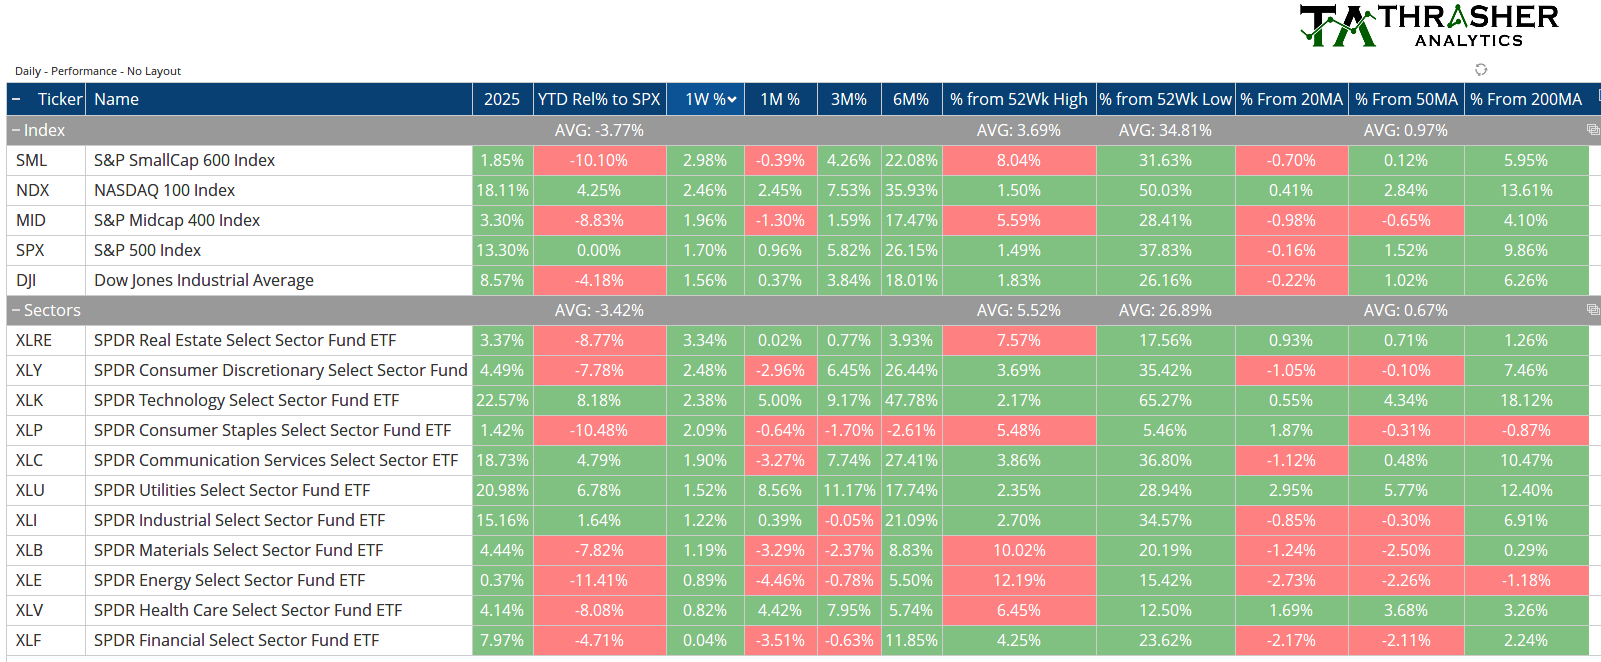
Stocks tried to rally last week and put in a positive performance for the S&P 500, but the Index has struggled to retake its 20-day moving average. Leadership during the week came from real estate, disc. and tech stocks. The 2nd Spotlight Chart looks at the breadth data across sectors and what it could mean for the Index going forward. The 50-day MA has been support for the Index but most stocks are trading below their own levels. With 43% above for large cap, 37% for mid cap, and just 34.6% for small cap still above their 50-MA. The 1st Spotlight Chart takes a look at the strength in silver. The precious metal has broken out but is starting to show some important bearish divergences that could put pressure on price action.
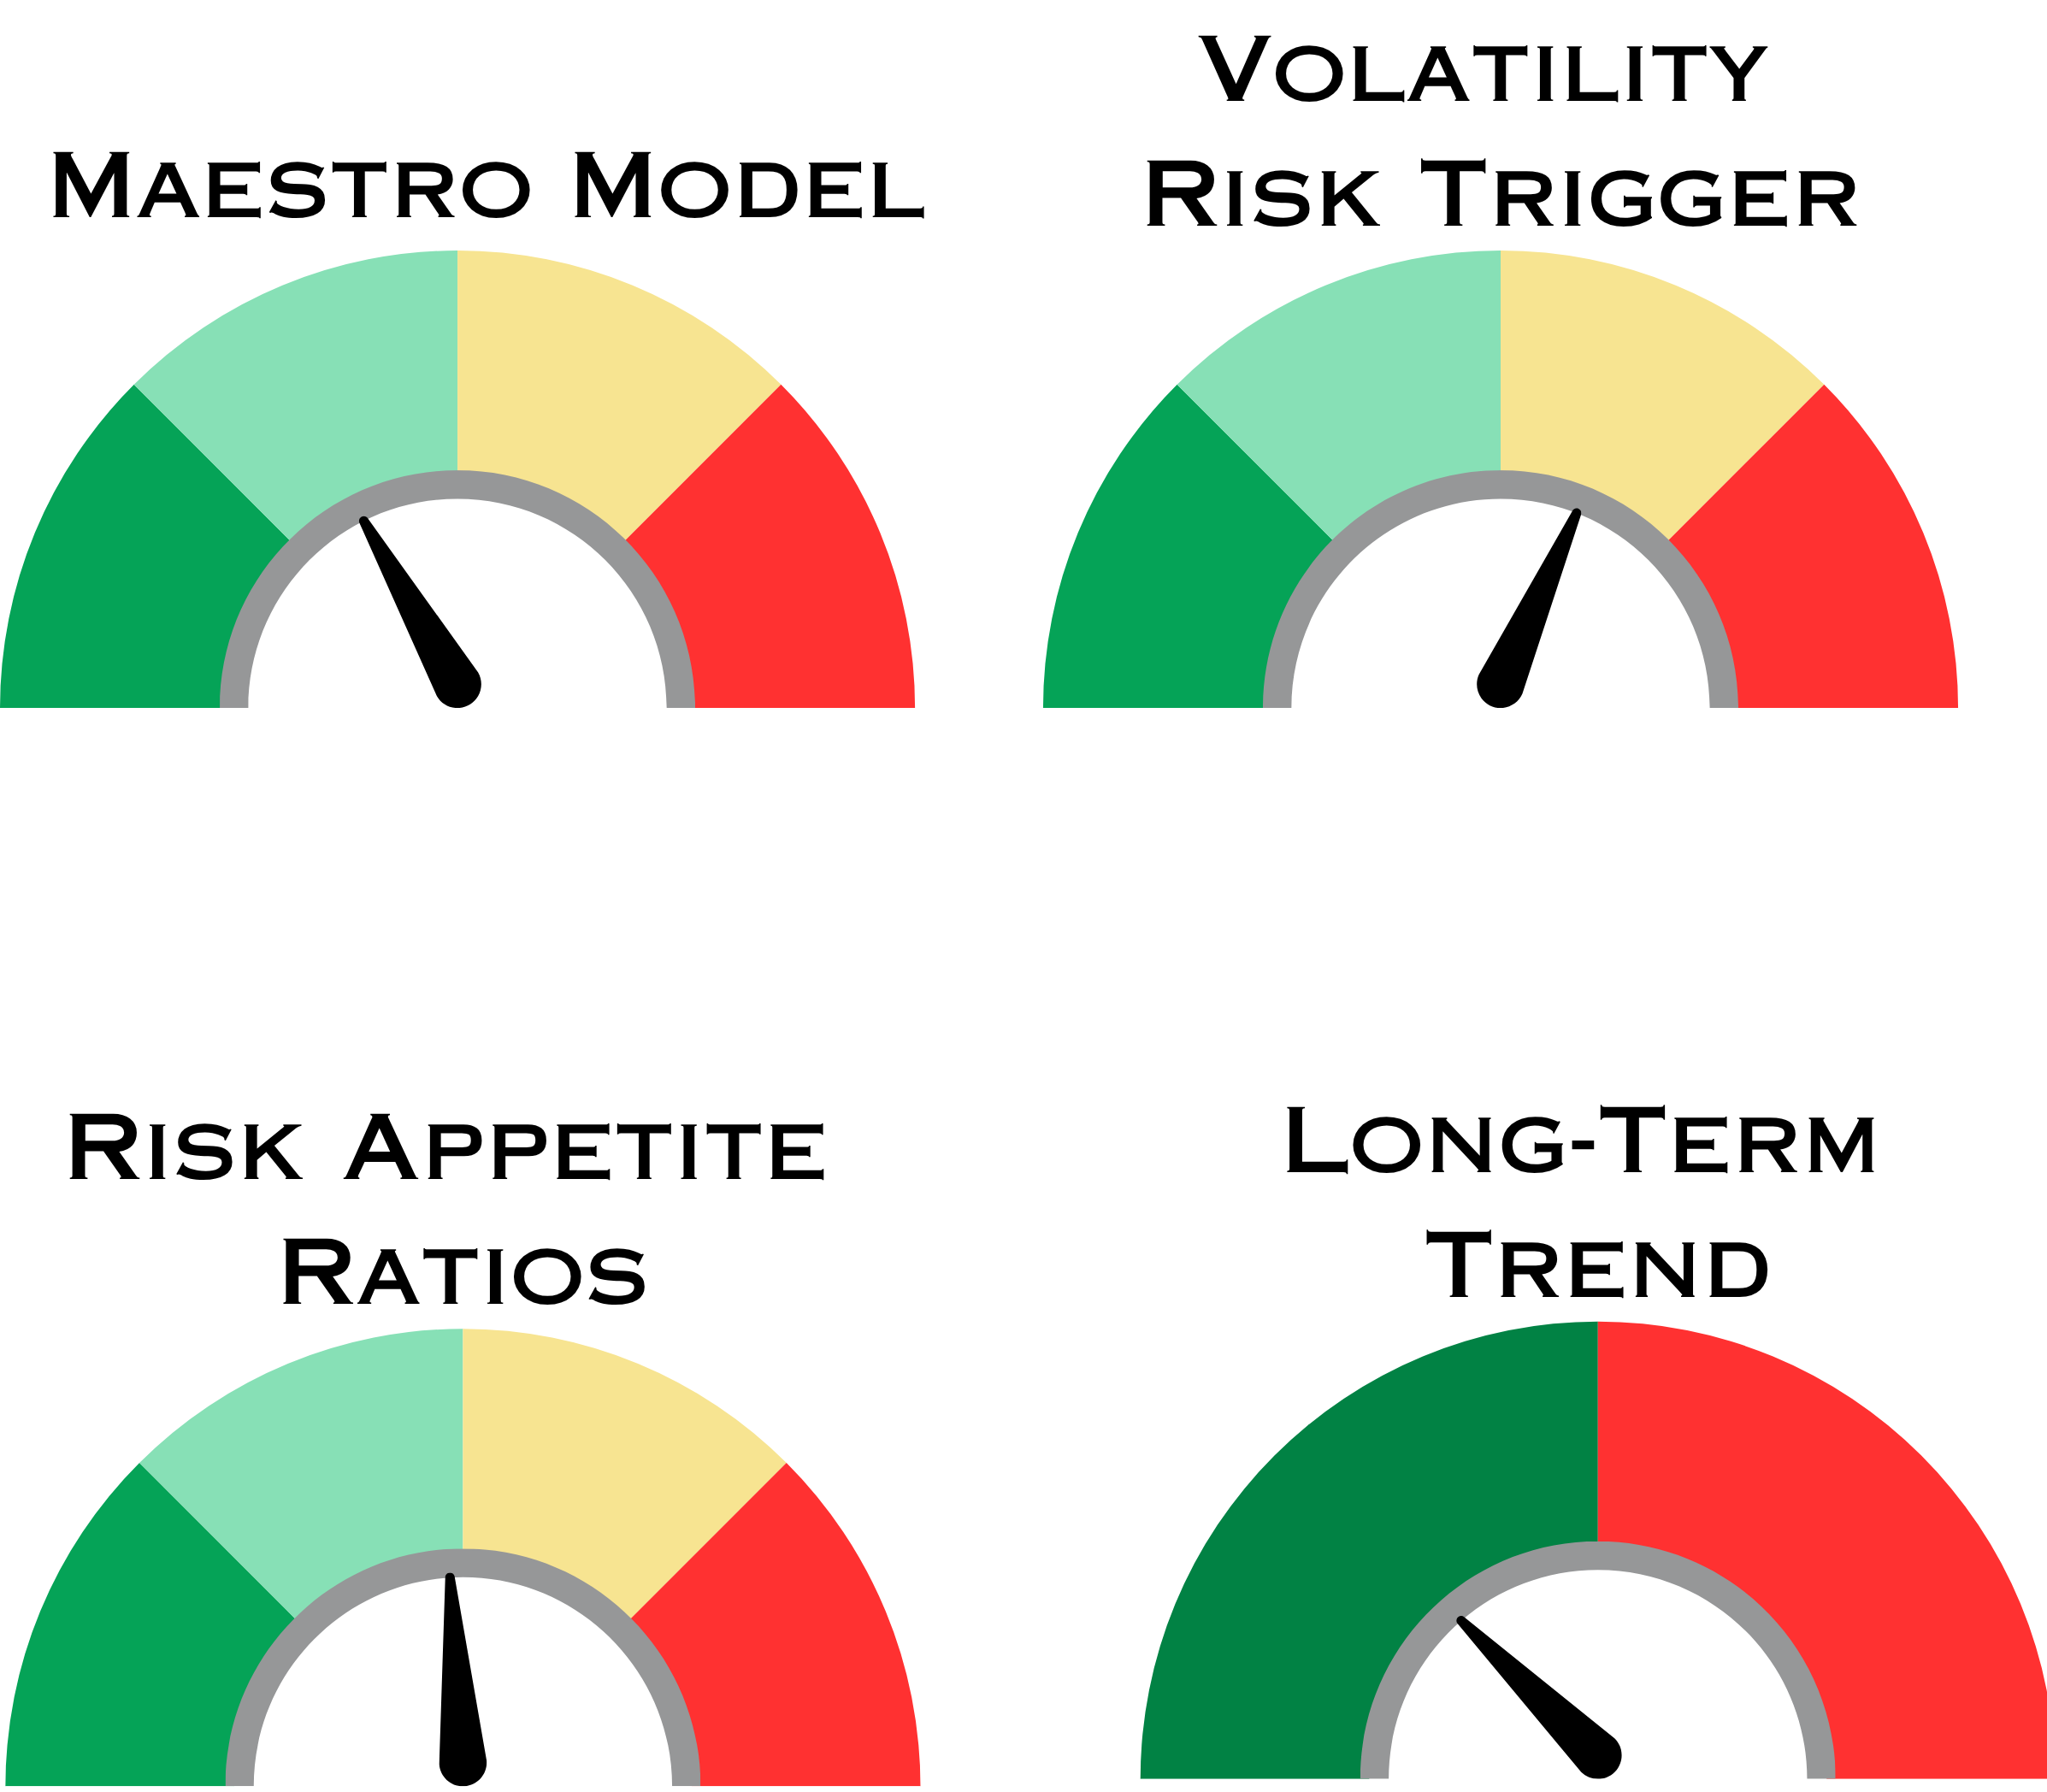
Summary of Models
Index & Sector Performance Summary
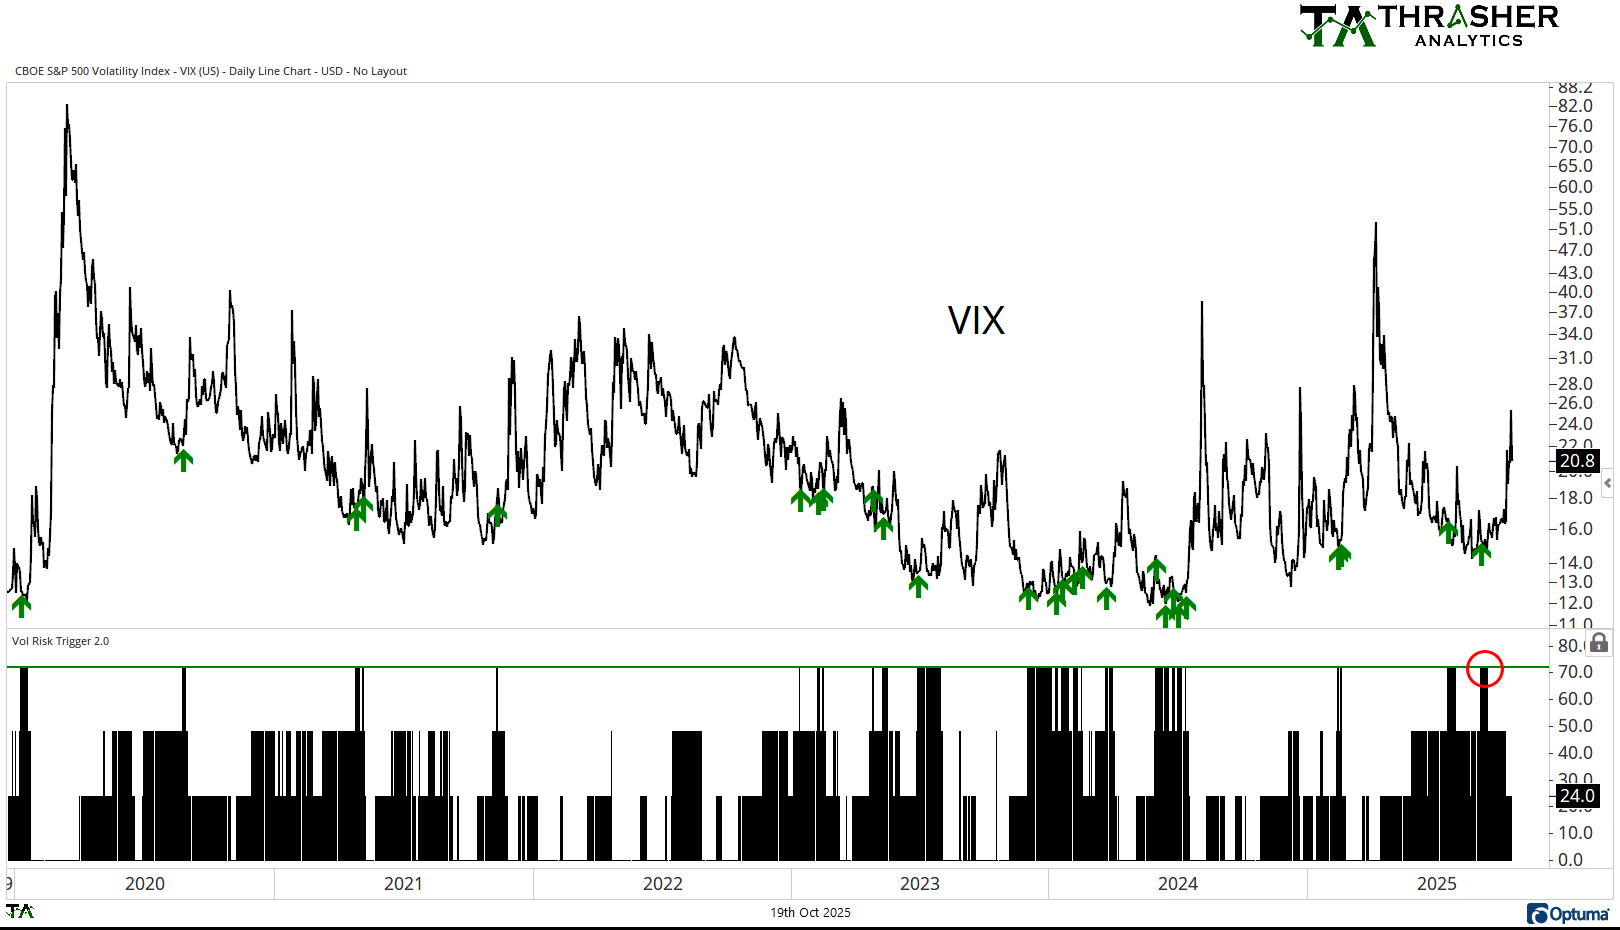
Volatility Risk Trigger
This week VIX reached an intraday high of 28.99, the highest level since when the VIX saw a massive spike higher in the first quarter. As discussed last week, the VRT did an excellent job signaling ahead of the move up in the VIX.
Keep reading with a 7-day free trial
Subscribe to Thrasher Analytics to keep reading this post and get 7 days of free access to the full post archives.