

I’ve got a lot to unpack in this week’s note, including model updates and three Spotlight Charts. The S&P 500 trend has flipped negative, but I share in the first Spotlight Chart what buyers need to accomplish to turn this to a very bullish setup. 6-month lows moved up to 11.73%, still fairly low but they are seeing a slight expansion that should be monitored. 20-day lows however have been making lower highs, peaking at 45% on March 12th, 44.3% on March 20th, and 39.7% on Friday. The Mega caps continue to be the tail that wags the dog as they were on the way up, with not a huge amount of panic selling hitting the market in the rest of the stocks just yet. In fact, Spotlight Chart #2 shows an example of this that has happened in the market more than a handful of times in 30 years.

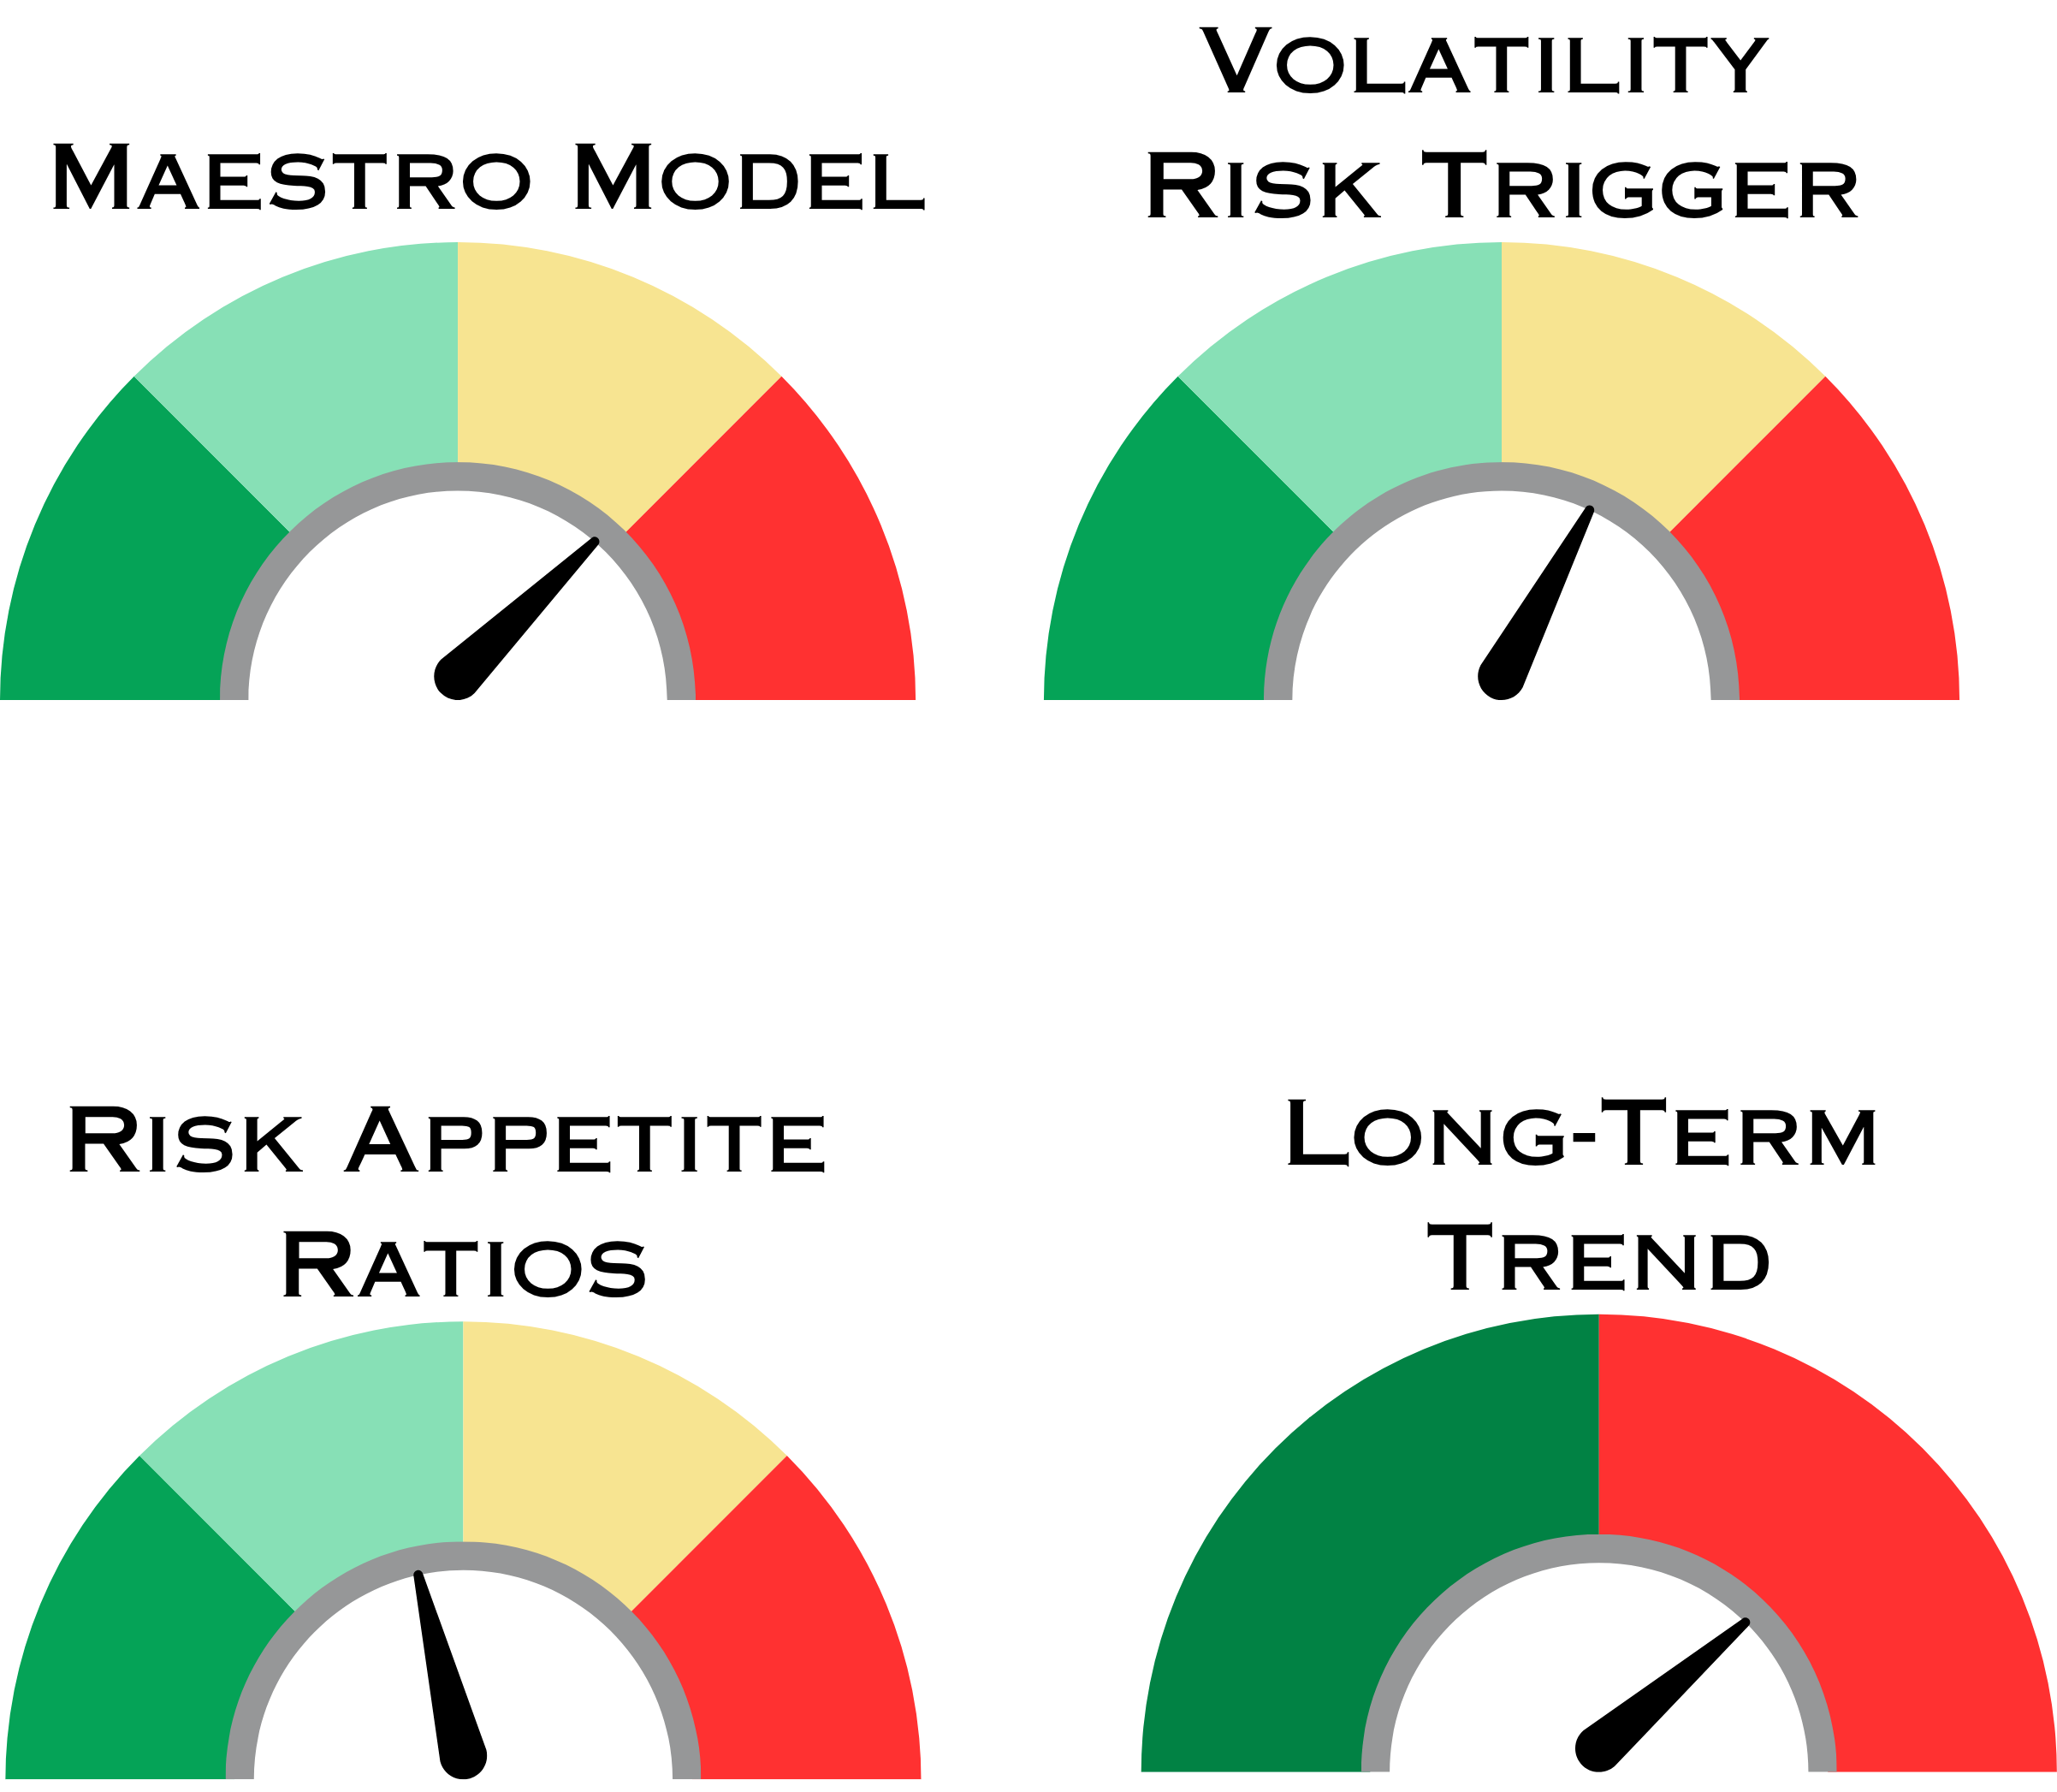
Summary of Models
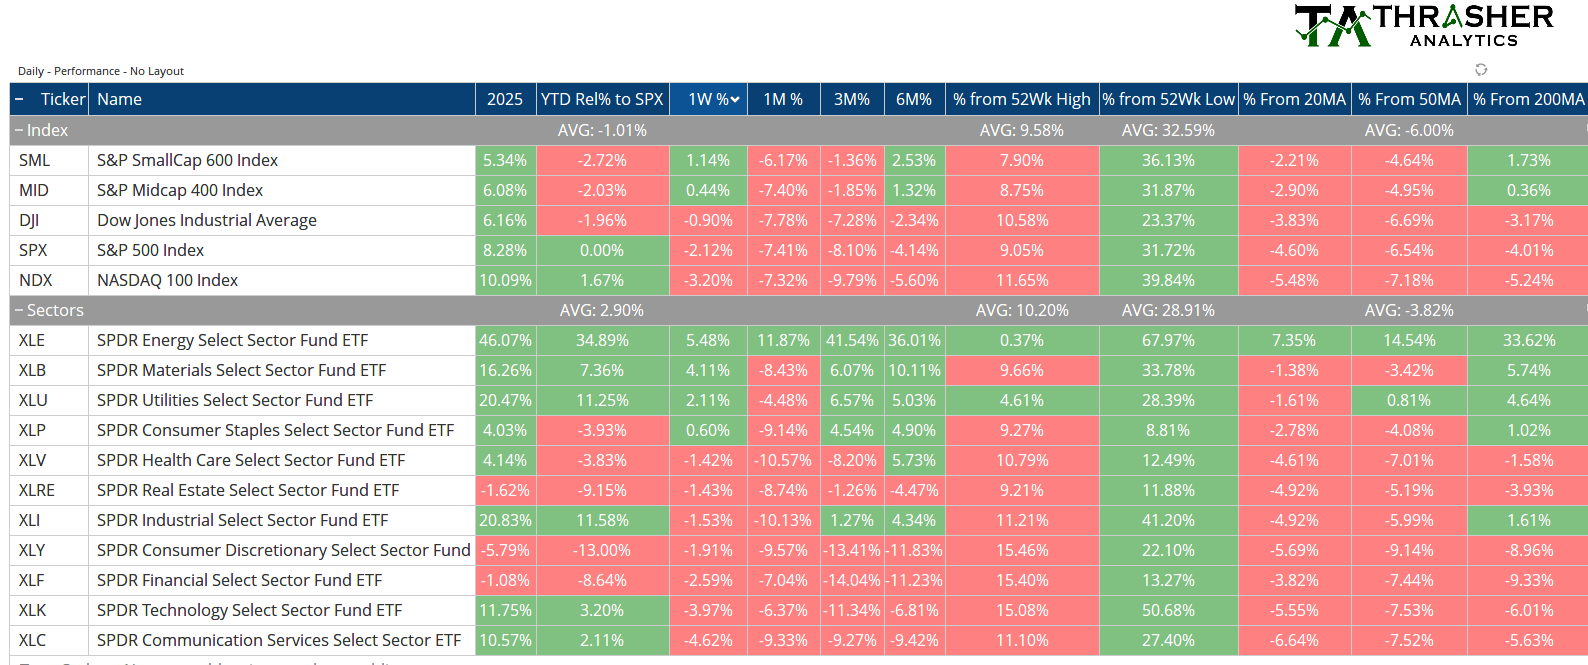
Index & Sector Performance Summary
Volatility Risk Trigger
VRT moved up to +24. However, most components are still well off their trigger thresholds.
I’ll be doing an update to the VRT very soon with the addition of a more aggressive signal using the same inputs but slightly relaxed thresholds. Stay tuned for more details!
Keep reading with a 7-day free trial
Subscribe to Thrasher Analytics to keep reading this post and get 7 days of free access to the full post archives.