VIX and the S&P 500 Move Together
A topic I’ve been discussing for the last couple of weeks in the Thrasher Analytics letter has been the interesting setups developing for the Volatility Index (VIX). For example, dispersion has contracted (as discussed in my paper, “Forecasting a Volatility Tsunami” and now we have an increase in the correlation between the VIX and the S&P 500.
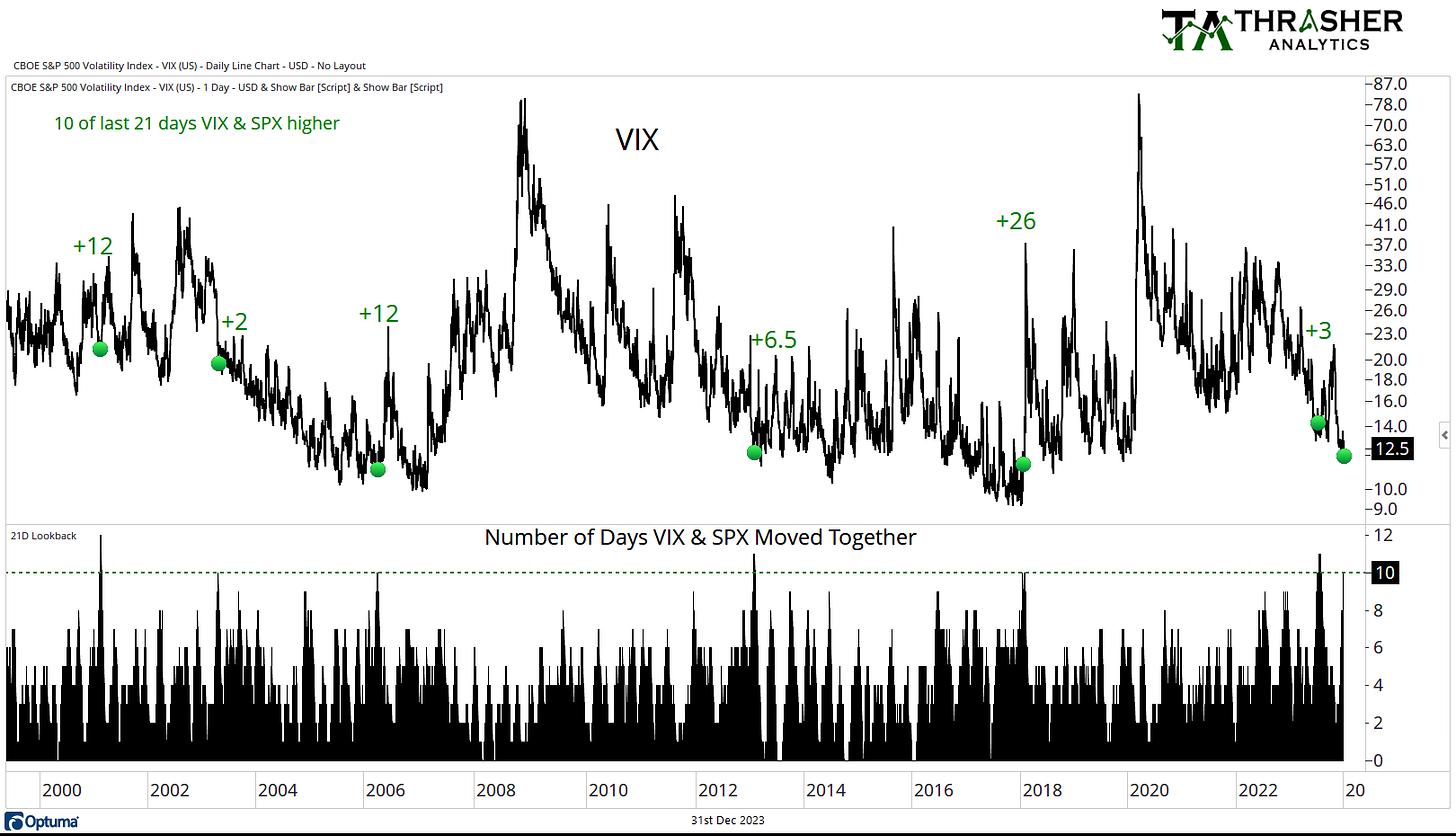
In Sunday’s letter to subscribers, I discussed the following chart which shows that the VIX and SPX has moved together in 10 of the last 21 trading days. This development has only happened six prior times since 2000, as its rare for equities and volatility to have a positive correlation for an extended period of time. Several of the prior occurrences saw a double digit rise in spot VIX.
Does this mean that the VIX must run to 70? Of course not, but it shows an abnormal development in its movement which historically has led to a firming up in the VIX.
Want to subscribe to Thrasher Analytics? Use code “substack” to get 15% off any of the three subscription options. Visit www.ThrasherAnalytics.com to learn more.
Disclaimer: Do not construe anything written in this post or this Substack in its entirety as a recommendation, research, or an offer to buy or sell any securities. Everything in this post is meant for educational and entertainment purposes only. I or my affiliates may hold positions in securities mentioned. 15% discount code “substack” applies to first subscription charge for time period selected upon subscribing, renewals will be at original price.


