

Volatility Timing Tools
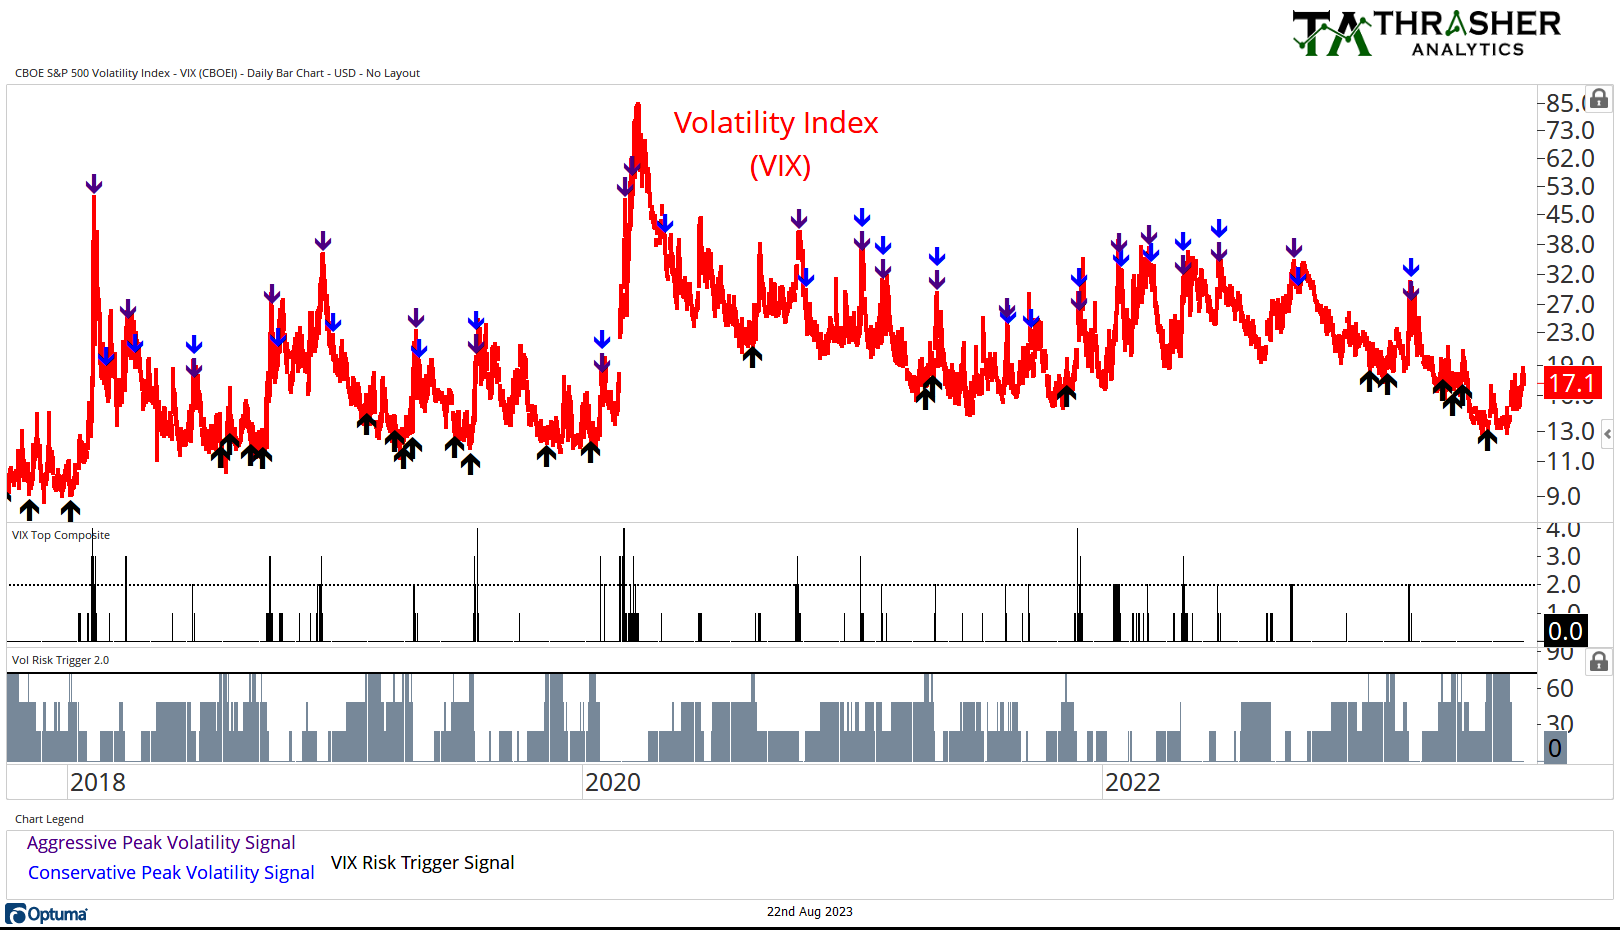
One of the first models shared in the weekly Thrasher Analytics letter is based on my first Dow Award winning paper from 2017, Forecasting a Volatility Tsunami. The concept from the paper was adapted for a timing tool focused on the VIX and led to the creation of the Volatility Risk Trigger, shown in the bottom panel of the chart below. This tool looks for period where the VIX has a higher-than-normal probability of making a major move higher. While of course not perfect, it has done an excellent job with the VIX-plosion in early 2018, mini-bear at the end of 2018, Covid Crash in 2020 and several other advances in volatility over the last several years. The most recent signal was on June 29th when spot VIX was at 13.5 and after three prior signals in April and May that had resulted in very minor moves in volatility.
Also shown in the model each week is a second tool to look for exhaustive peaks in the VIX. These are categorized as Aggressive and Conservative Peaks. The difference between the two are signal thresholds as well as confirmation in changes in volatility.
Combined, these two tools, along with the additional commentary on volatility, provide subscribers insight into opportunistic periods in the volatility market and/or edges in risk management for equity markets.
Want to subscribe to Thrasher Analytics? Use code “substack” to get 15% off any of the three subscription options. Visit www.ThrasherAnalytics.com to learn more.
Disclaimer: Do not construe anything written in this post or this Substack in its entirety as a recommendation, research, or an offer to buy or sell any securities. Everything in this post is meant for educational and entertainment purposes only. I or my affiliates may hold positions in securities mentioned. 15% discount code “substack” applies to first subscription charge for time period selected upon subscribing, renewals will be at original price.