

When Santa Brings Volatility
An Annual Setup for a Move in the VIX
As a thank you to the over 400 of you that have subscribed since I moved Thrasher Analytics to Substack, I’m making this post unlocked and available for free. Typically, this is the type of content shared exclusively with paid subscribers and will be in the future. I wish you all a belated Merry Christmas and a Happy New Year!
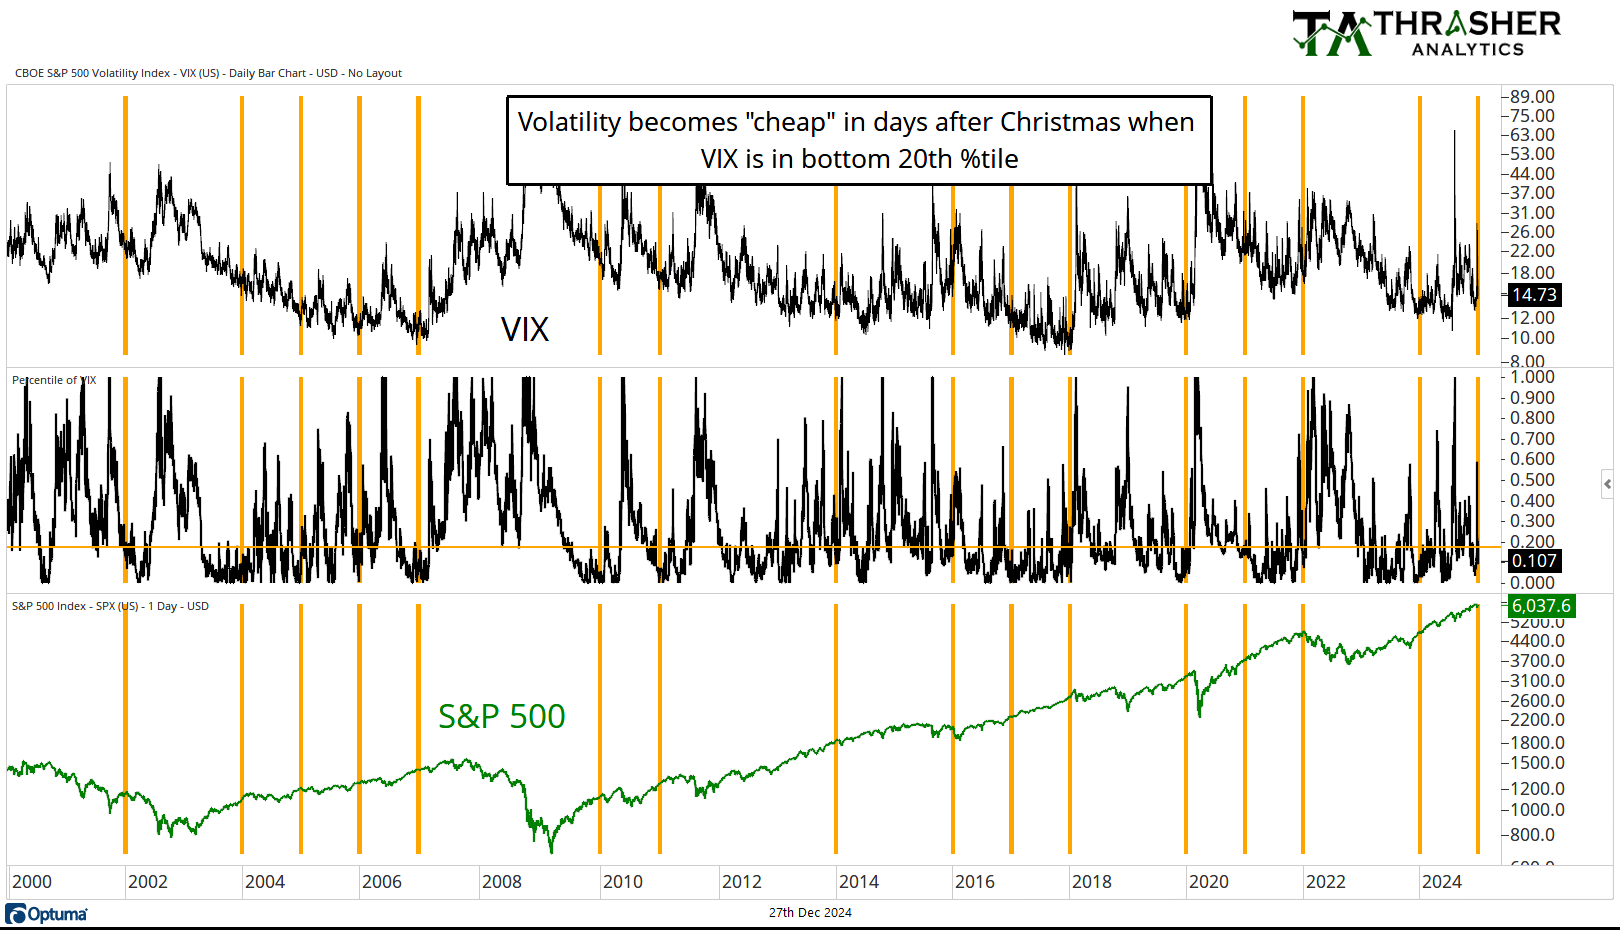
One note I share with Thrasher Analytics subscribers at the end of each year is when there’s potential for Santa to bring Volatility. This is based on a study of where the Volatility is ins one year range following the Christmas holiday. This is the time where we start reading a lot of articles about the seasonal Santa rally, where stocks see favorable price action at the end of December into the early part of January. There’s one caveat to that, and wits when Santa decides to bring Volatility instead of presents to Wall Street.
The chart below shows a long-term look at the VIX, the percentile of the VIX, and the S&P 500. I’ve plotted orange lines when after Christmas, VIX is in the bottom 20th percentile. It doesn’t happen every year, but it has happened enough to give us some data.
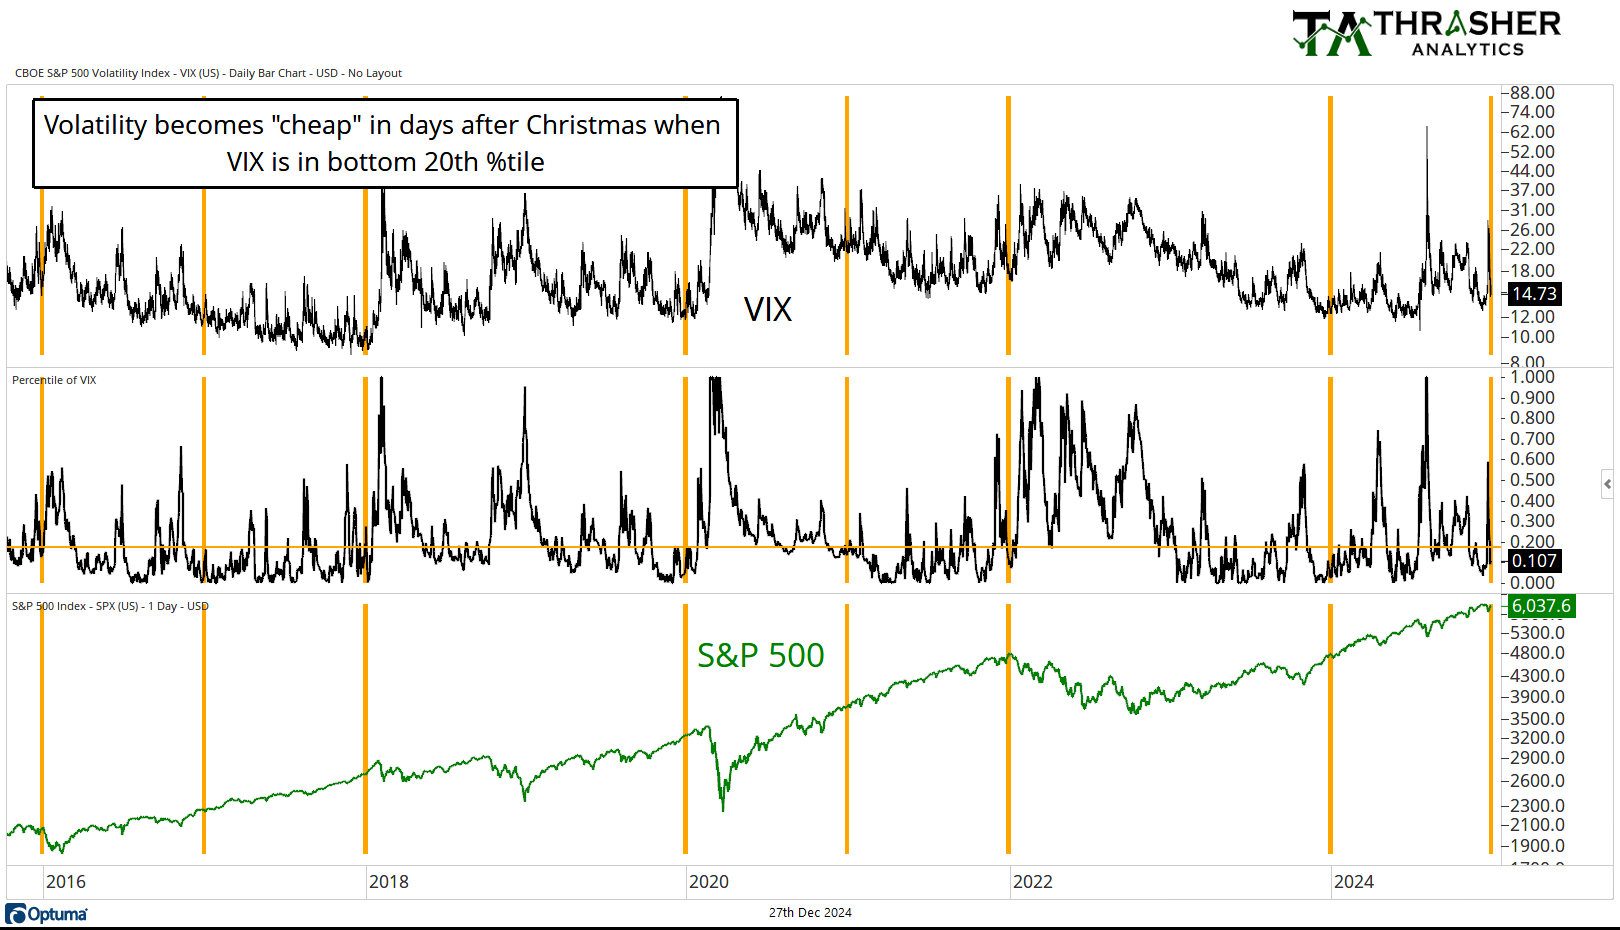
Here’s a zoomed in look since 2016. This chart gives a better look at the last eight times when the VIX finished the Christmas holiday at one of its lower levels of the year, setting up for some volatility into the new year.
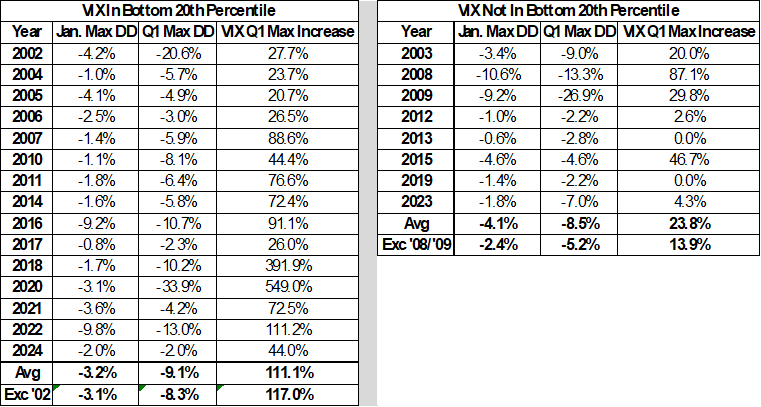
Looking at the data year by year, I’ve done a rough calculation of the drawdowns in January, Q1 and the rise in the VIX. Yes, the VIX change is shown in percentages when itself is a percentage, I know that’s technically not correct but allows a more apples-to-apples comparison, so please don’t email me. We can see on both sides of the table that it’s not out of the ordinary to see the VIX rise in Q1, but when VIX starts in the bottom 20th percentile, the increases have been much larger than when it doesn’t. The S&P 500 saw larger drawdowns in the first three months of the year in these setups vs. when the VIX was already elevated.
The additional level of analysis we can apply to this study is drawing from my paper, Forecasting a Volatility Tsunami. Which looks at periods when the VIX is compressed and how that condition often leads to a spike higher. The years that did see a compressed VIX included: 2002, 2004, 2005, 2006, 2007, 2011, 2016, 2018, 2020, and 2024. These are years that saw some of the largest moves in the VIX, 2022 being a standout year, as VIX was compressed in November before a prior 100% rise (again, forgive the percentage of a percentage discussion!). This go around, the VIX is not compressed having just seen a large move higher earlier in December.
From here, I’m watching if we see a more volatile first quarter of 2025. This doesn’t mean that Santa can’t’ still bring some gains for the equity market, the table shows that the January declines at times are minimal, while still seeing a material rise in Volatility during the full quarter.
No reproduction, transmission, or distribution permitted without consent of Thrasher Analytics LLC ("Thrasher Analytics"). The material contained herein is the sole opinion of Thrasher Analytics. This research has been prepared using information sourced believed to be reliable. Such information has not been independently verified and no guarantee, representation or warranty, express or implied, is made as to its accuracy completeness or correctness. It is intended for the sole use by the receipt to whom it has been delivered to by Thrasher Analytics. The delivery of this report to any person shall not be deemed a recommendation by Thrasher Analytics to affect any transaction in any securities discussed herein. For more information, please refer to the Disclaimer/Terms & Service page of our website.