

Updated Models & Spotlight Chart 12/29/2024
A Bounce In the SPX But Another 90% Down Day
Last week’s Spotlight Chart suggested we could get a bounce higher in the broad market based on the low number of stocks above a short-term moving average. The S&P 500 did in fact bounce higher, closing up 0.66% on the week despite the -1.11% decline on Friday. XLV, XLK, and XLE were the sector leaders on the week. We’ve now had multiple 90% down days in the S&P 500, something I’ll be watching closely going forward as these can tell us when bears are growing in number. Looking again at Friday’s decline, the Mag 7 accounted for half of the decline (and are 32% of the Index weighting), which resulted in 78% of stocks outperforming. While most stocks didn’t decline as much as the Index, the 90% down day still shows heavy selling. To that point, the equal weight S&P 500 is just 2.88% above its 200-day MA compared to 22.4% for the Mag 7 group and 7.7% for the cap weighted S&P 500.
On Friday I wrote an unlocked post, When Santa Brings Volatility, looking at an annual VIX setup I write about each year it occurs, be sure not to miss it.
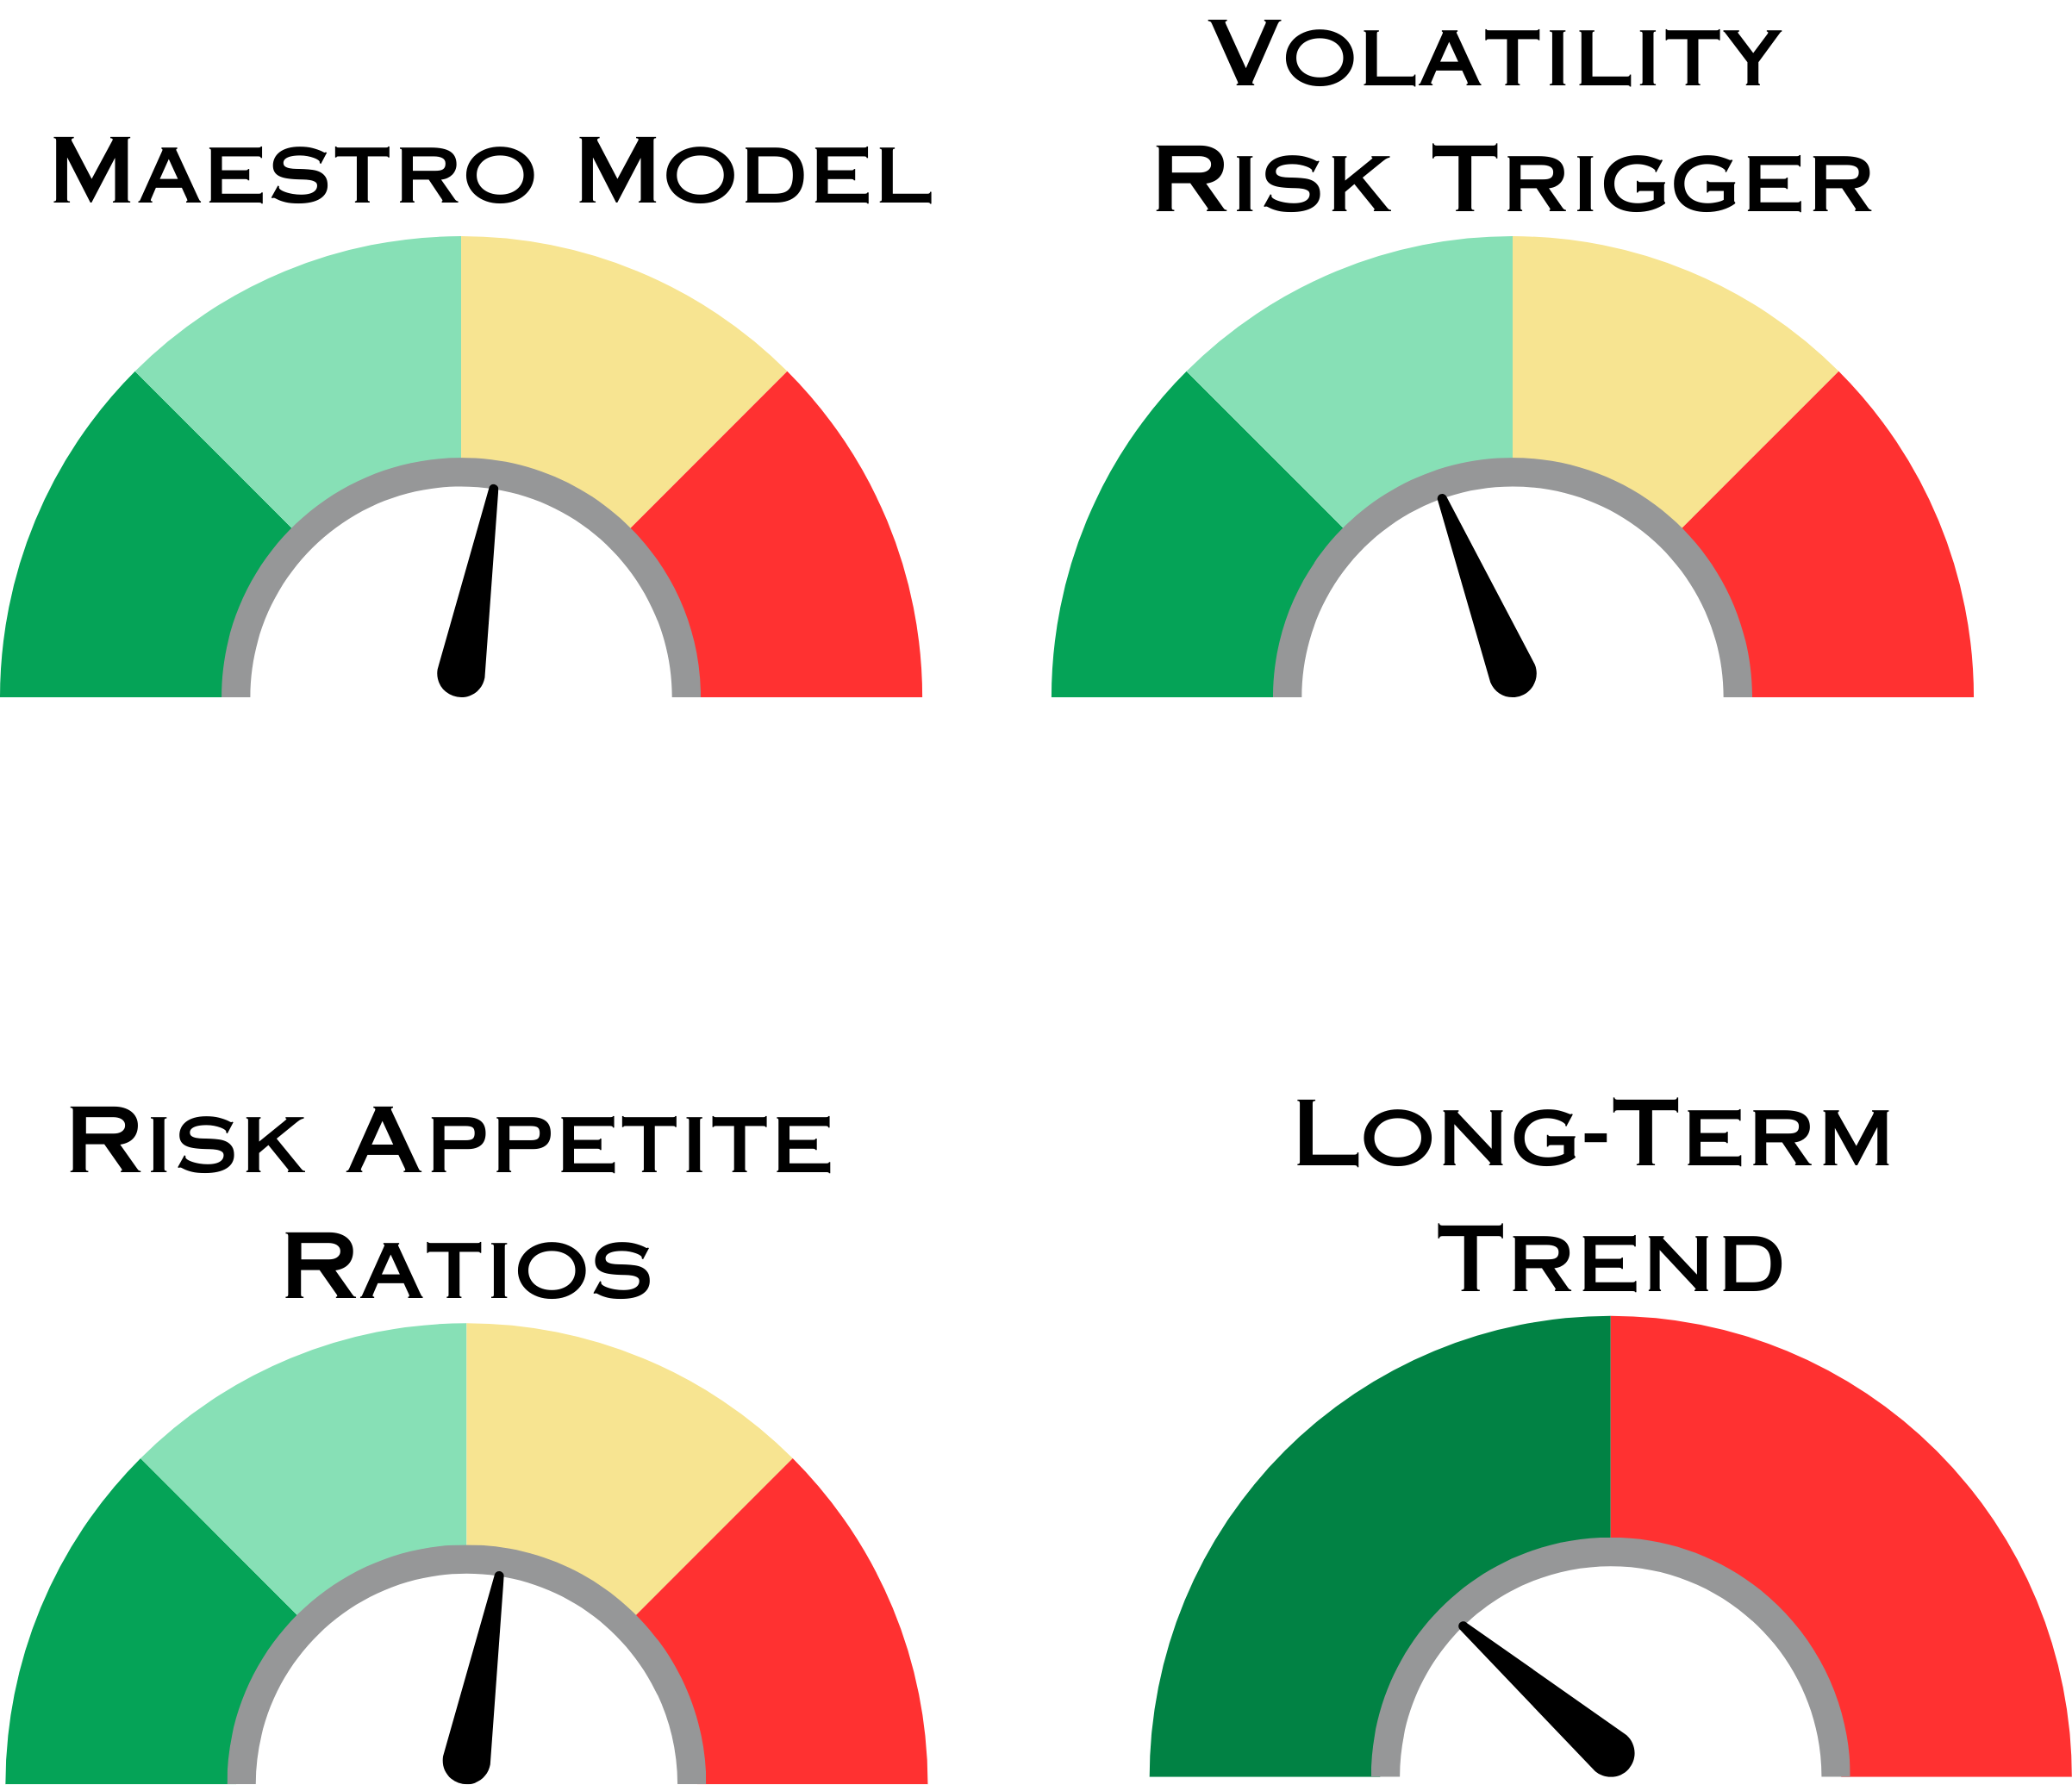
Summary of Models
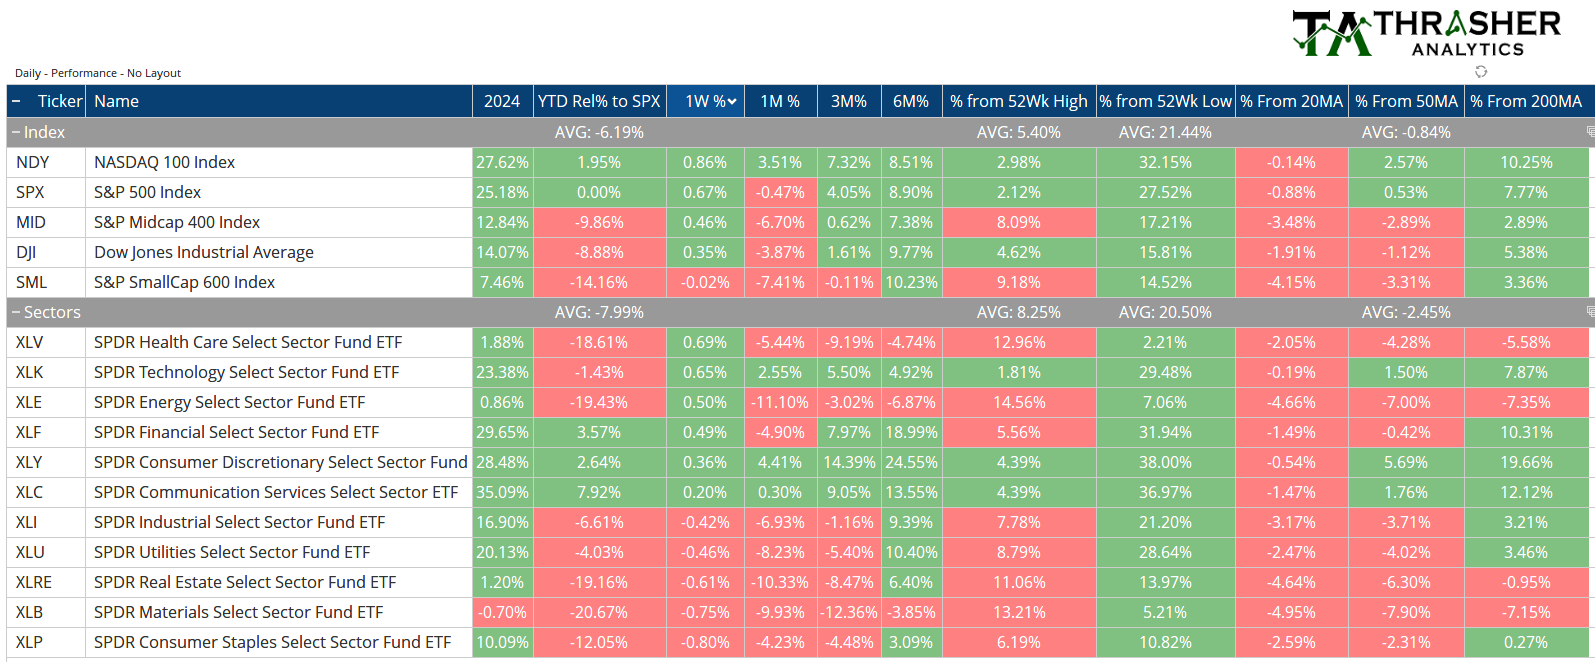
Index & Sector Performance Summary
Keep reading with a 7-day free trial
Subscribe to Thrasher Analytics to keep reading this post and get 7 days of free access to the full post archives.