

As of this week, the number of paid subscribers to Thrasher Analytics have doubled since moving the letter to Substack at the end of last October. Thank you to all that have shown your support in Thrasher Analytics. It’s an honor to be a source of trusted analysis among a sea of options available to you.
The S&P 500 rose almost 5% last week, rising back above its short-term 20-day moving average with leadership coming from XLK, XLY, and XLC sectors. There have been several breadth thrusts as buyers step back into the equity market. One Spotlight Chart looks at one thrust that has yet to show in in the Nasdaq Composite. The Thrust Composite is at +3 currently, while a positive sign is when we get to 4 or more that have been meaningful. Instance we had 3 thrusts at the Nov. ‘18 counter-trend rally that resulted in the Index unable to hold above its 200-day moving average. Again, in April ‘22 when the Index was also unable to hold its long-term average. The SPX is approaching some key moving averages, sitting 2.4% below the 50-day MA and 3.9% under the 200-day. Friday’s price action got us a couple points above the March pivot low, but the day’s breadth saw only 40% of stocks move higher. The rally in equities has been a nice reprieve, it’s 9% higher since I wrote about the Bottom Fisher hitting +7 and the Aggressive Bullish Signal in the Maestro Model. I’d also note the 11.5% rise in Bitcoin since the Spotlight Chart on 4/13.
This week’s Spotlight Charts look at the sector relative performance since the April SPX low as well as what I’d like to see develop below the surface in Nasdaq stocks to confirm a material low has been made.
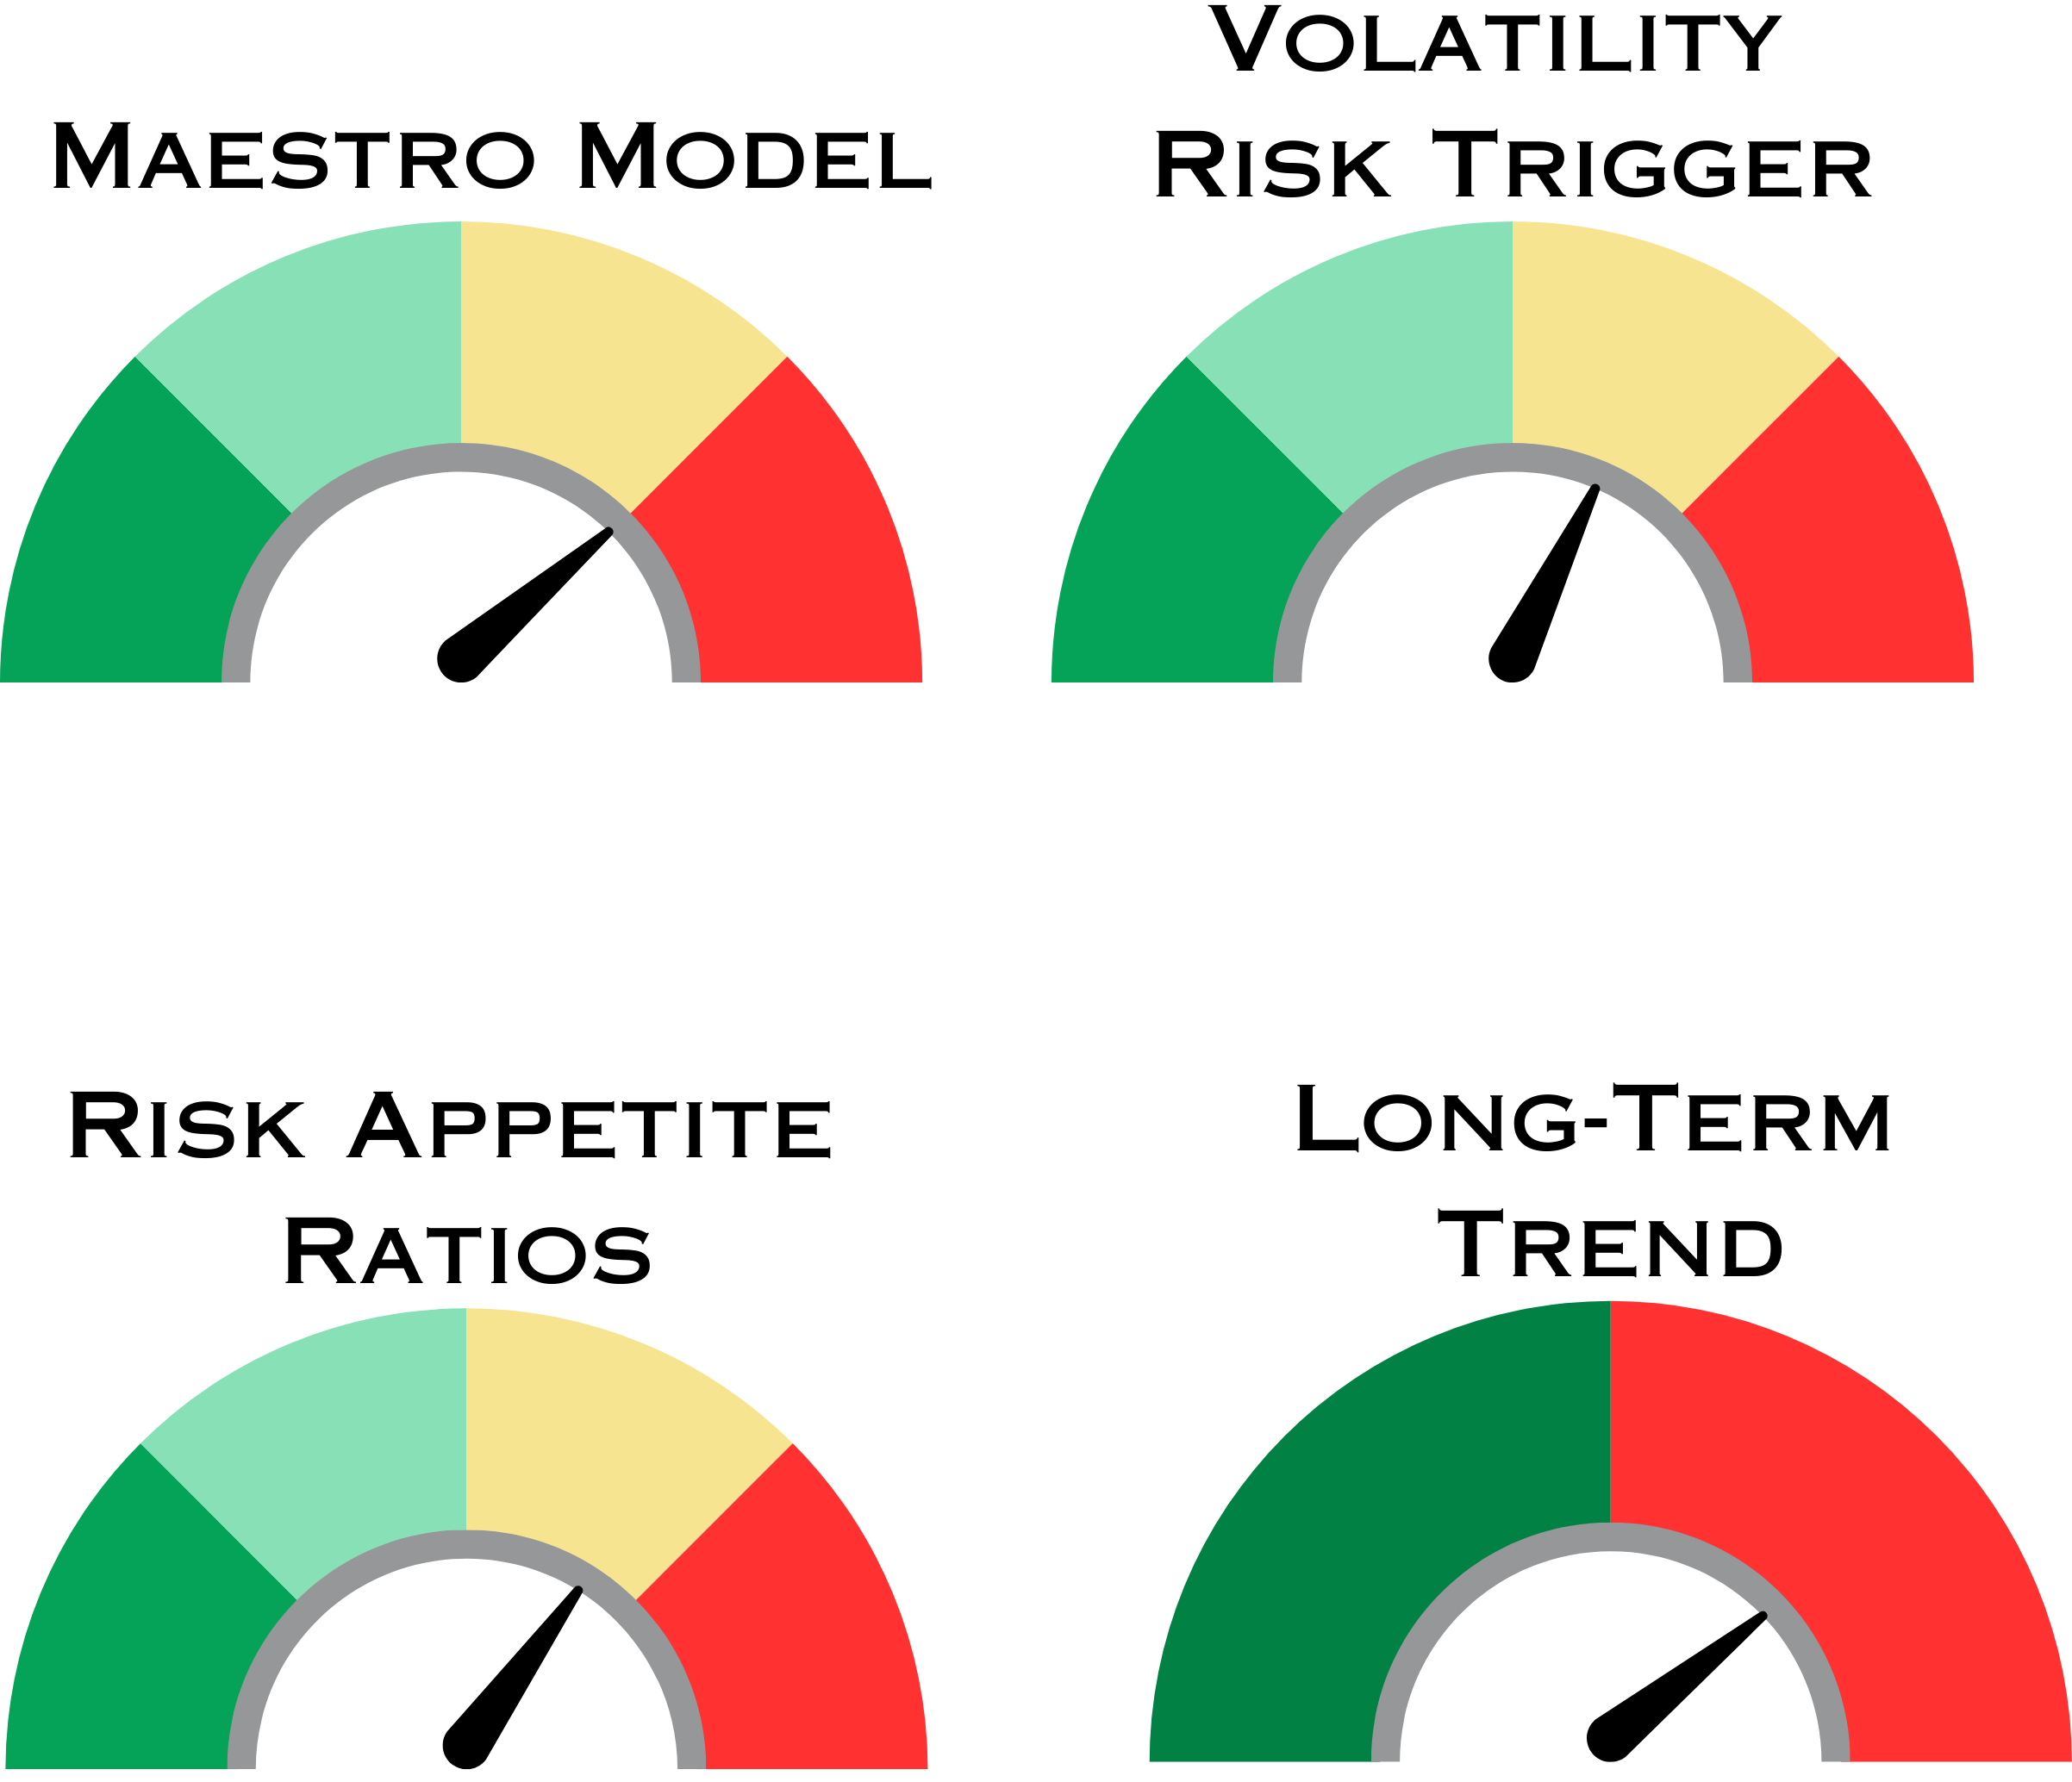
Summary of Models
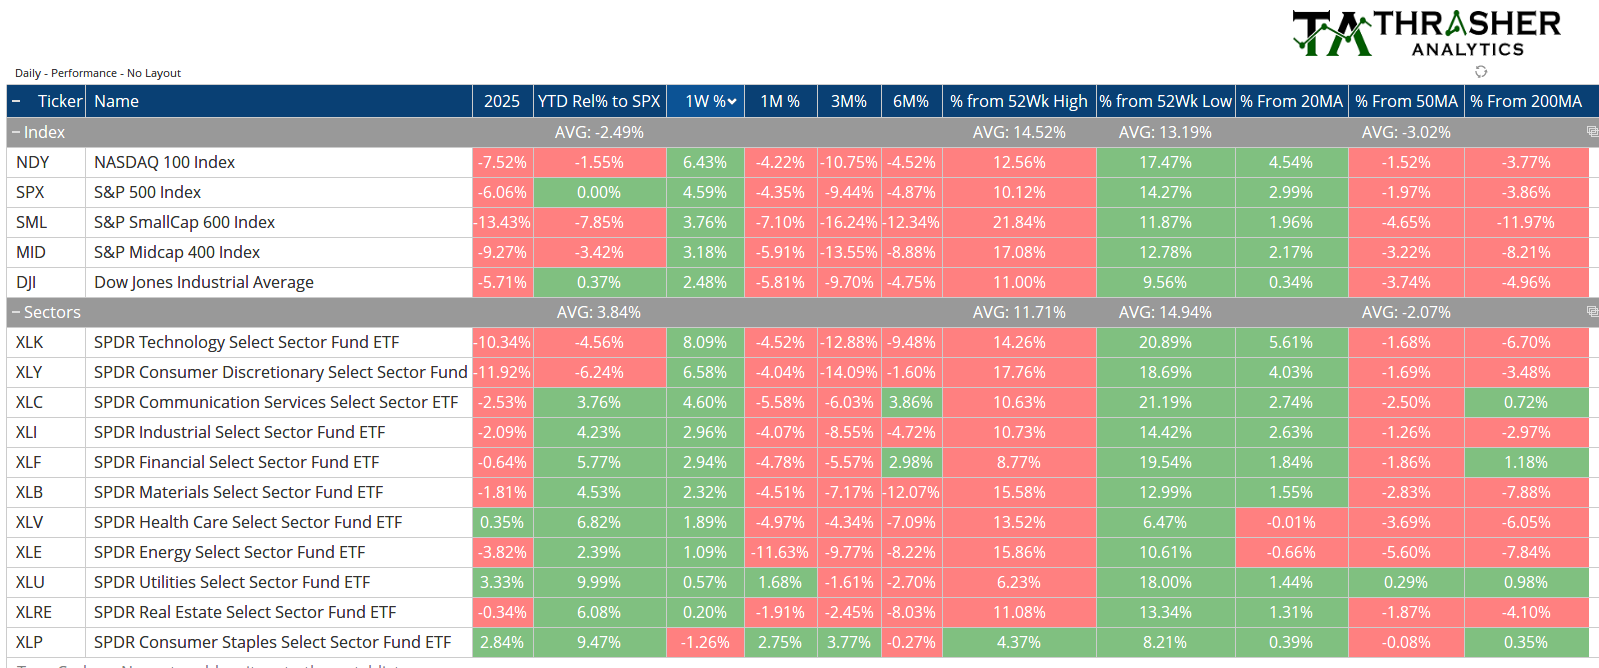
Index & Sector Performance Summary
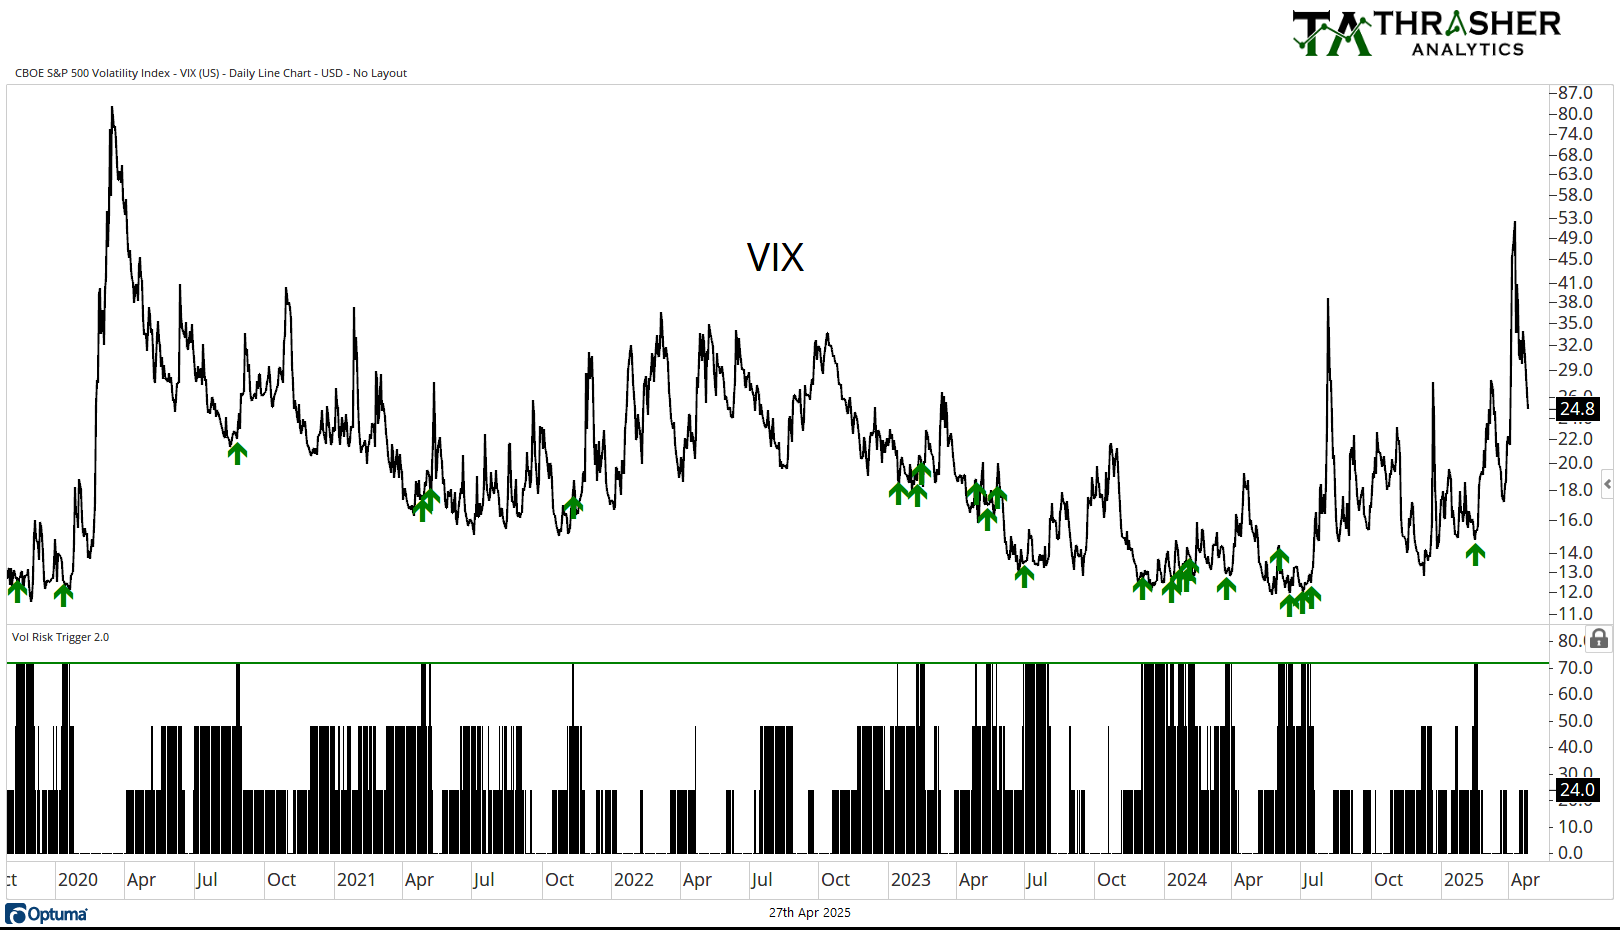
Volatility Risk Trigger
VIX Continues to move lower, finishing the week below 25. The VRT remains at 24, below a threshold for a signal.
Keep reading with a 7-day free trial
Subscribe to Thrasher Analytics to keep reading this post and get 7 days of free access to the full post archives.